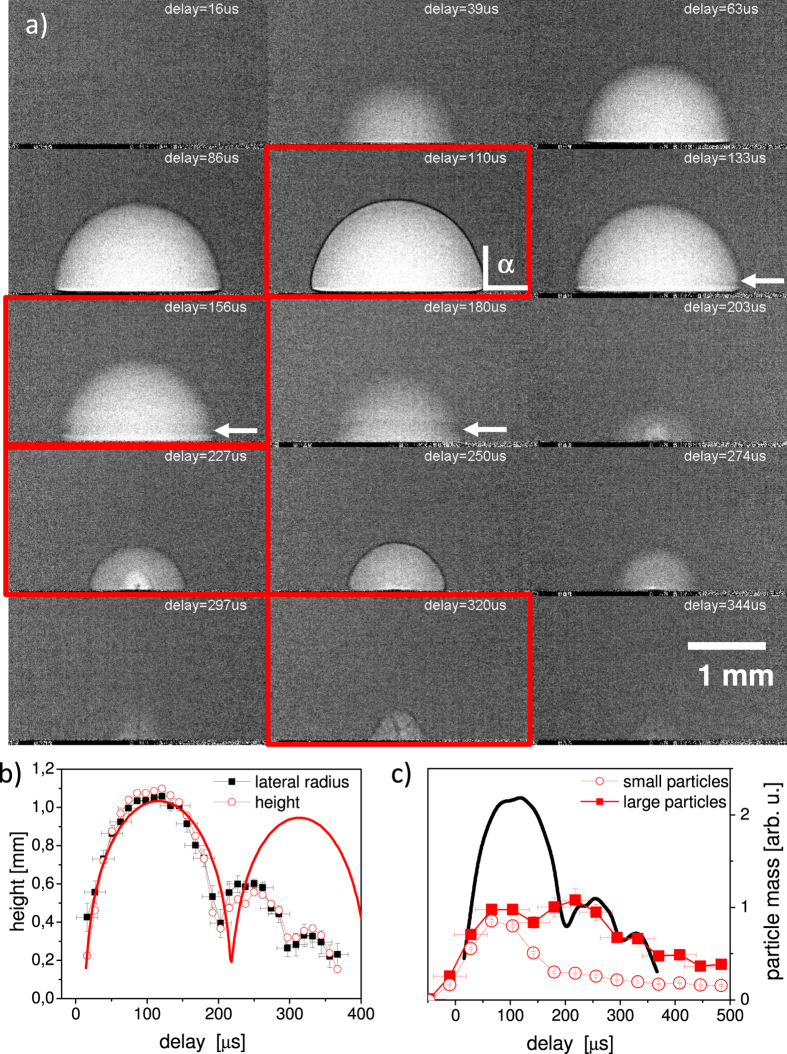
Figure 2.
(a) Averaged X-ray radiographs of the bubble kinetics at selected delays after laser impact, some critical frames are highlighted: the largest extension of the first bubble at 110 μs; shrinking of the first bubble at 156 μs; second bubble (rebound) at 227 μs; jet formation after the second bubble has collapsed at 320 μs. Brighter pixels correspond to higher X-ray transmission. (b) plot of the lateral and vertical bubble radius as function of delay. Error bars are in both cases similar. The solid line is a simulation according to the Rayleigh-Plesset equation. (c) Mass of ablated particles at a height of 0.5 mm as function of delay. The line indicates the bubble size change according to (b). The arrows mark the rim. The contact angle is indicated by α.

