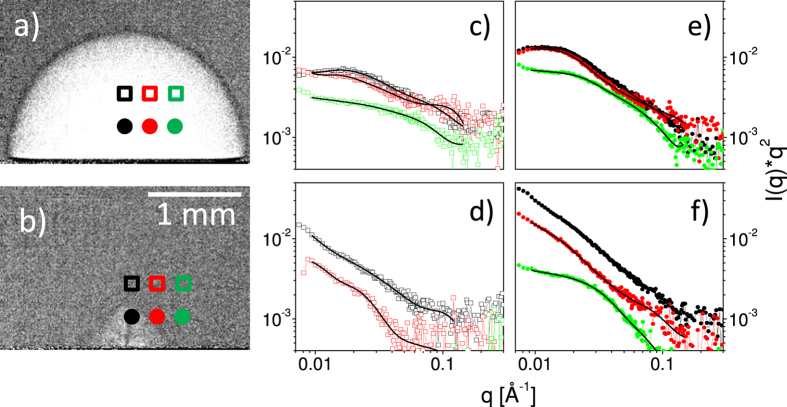
Figure 4. Selected radiographs at 110 μs (a) and 320 μs (b) with indicated locations for the SAXS measurements.
Corresponding SAXS (c–f) curves within the Kratky representation (I(q) * q2) at the chosen points in time and space relative to the bubble formation are shown to the right of the two XR delays. The data at 0.8 mm height, (c,d), is drawn by open symbols, while data at 0.5 mm height, (e,f), is represented by full symbols. The topmost curves (highest intensity) are always at the center, followed by an increasing lateral displacement. The lines are fits to the data.

