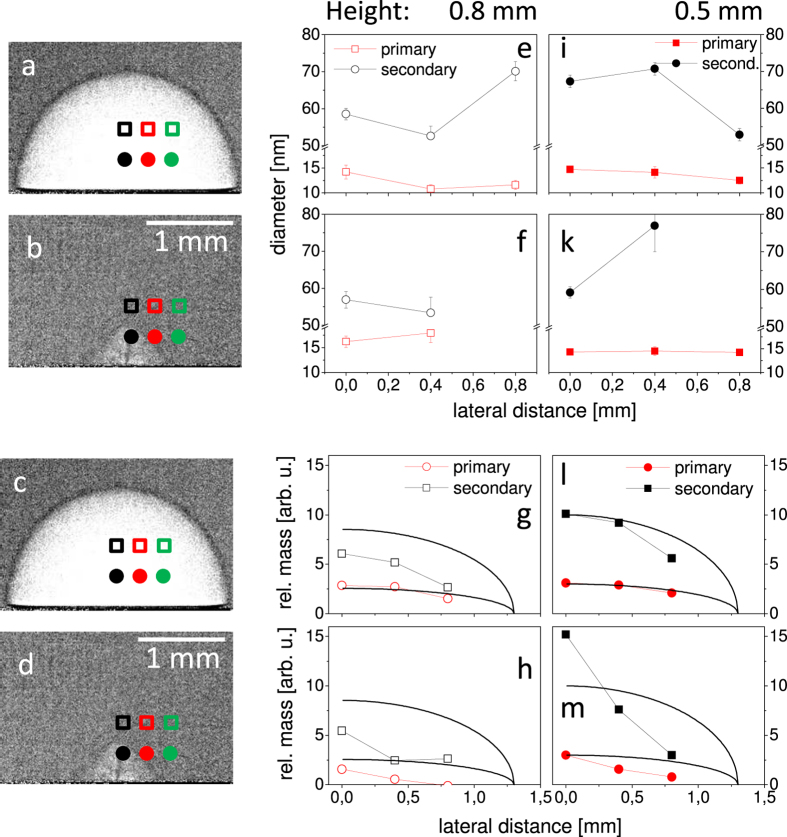
Figure 5. Selected radiographs at 110 μs (a,c) and 320 μs (b,d) with indicated locations of the SAXS analysis.
Corresponding sizes of the fractions of primary and secondary particles at different positions within the bubble and the two time delays, (e,f,i,k), and the relative mass of these fractions, (g,h,l,m), as determined from the SAXS invariant at different positions within the bubble and two time delays. The full lines in (g,h,l,m) scale with the bubble thickness as guide to the eye at the respective height.

