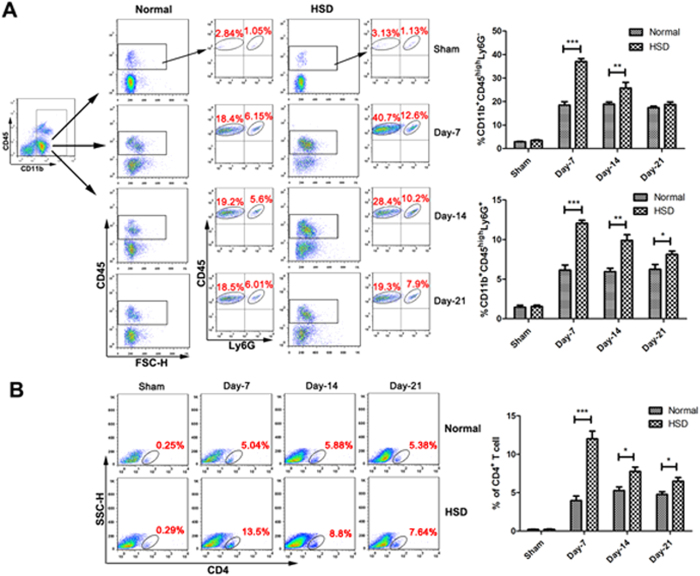
Figure 3. High-salt diet exacerbated infiltration of macrophages, neutrophils and CD4+ T lymphocytes in pMCAL.
(A) Infiltration of macrophages (CD11b+CD45highLy6G−) and neutrophils (CD11b+CD45highLy6G+) determined by flow cytometry in the ischemic brain hemispheres of the normal diet and high-salt diet mice. (n = 6 per group; *P < 0.05, **P < 0.01, ***P < 0.001). (B) The percentages of infiltrated CD4+ T cells lymphocytes in the ischemic brain tissue are shown (Representative data on the left, quantification bar graph on the right). (n = 6 per group; *P< 0.05, ***P < 0.001). Values are mean ± SD.

