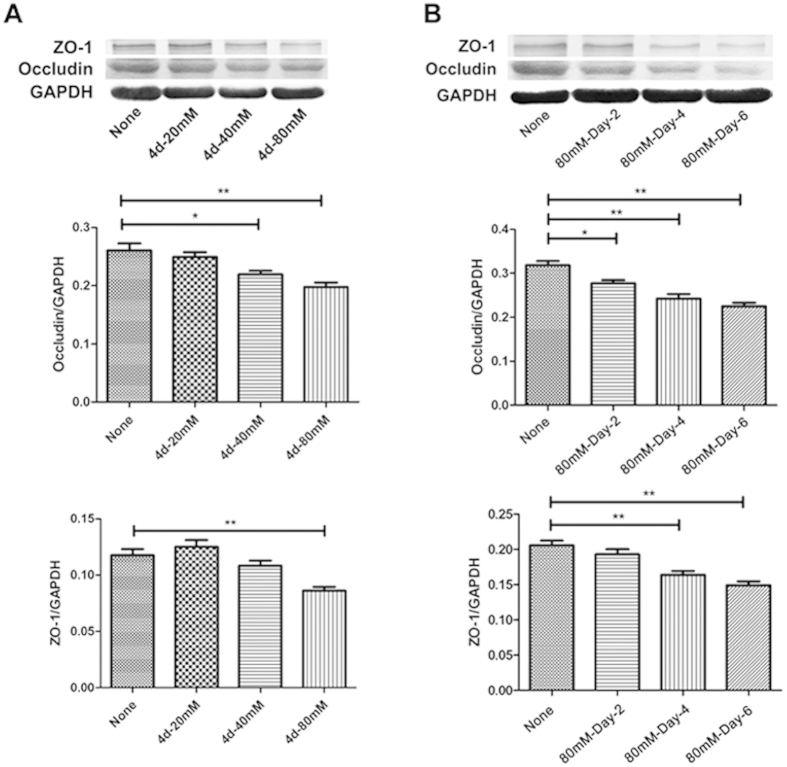
Figure 4. Additional salt stimulation down-regulated the expression of ZO-1 and Occludin in bEnd.3 cultures.
(A) The expression of ZO-1 and Occludin in bEnd.3 cells after NaCl treatment at various concentrations and (B) indicated time points is detected by western blotting (*P < 0.05, **P < 0.01, ***P < 0.001). The data represent are pooled results from four independent experiments. (*P < 0.05, **P < 0.01, ***P < 0.001). Values are mean ± SD.

