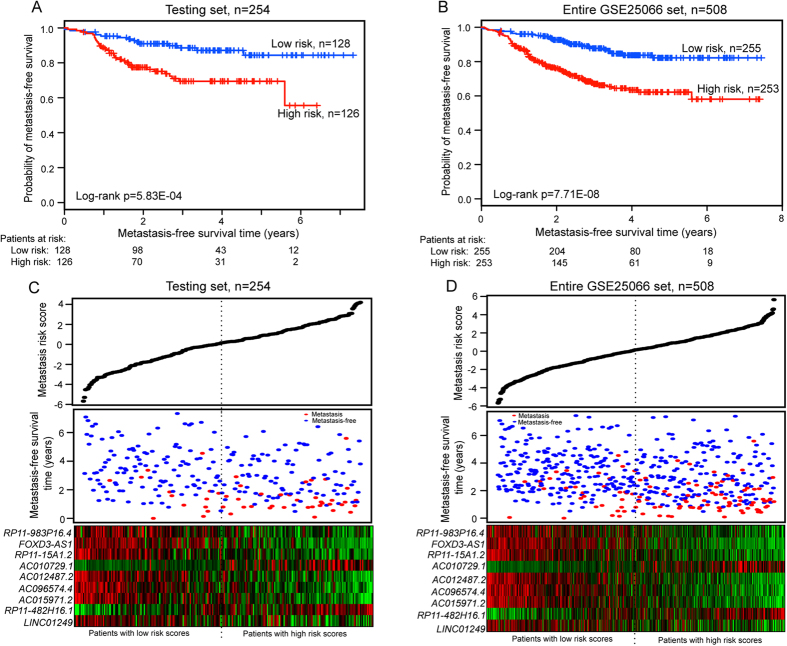
Figure 2. Performance evaluation of the nine-lncRNA signature for MFS of breast cancer patients in the testing dataset and entire GSE25066 dataset.
(A) Kaplan-Meier curves for patients in the testing dataset (n = 254). (B) Kaplan-Meier curves for patients in the entire GSE25066 dataset (n = 508). The two-sided Log-rank test was performed to test the difference for MFS between the high-risk and low-risk groups. The number of patients at risk was listed below the survival curves. (C) The distribution of the metastasis risk score, patients’ metastasis status and lncRNA expression in the testing dataset. (D) The distribution of the metastasis risk score, patients’ metastasis status and lncRNA expression in the entire GSE25066 dataset.

