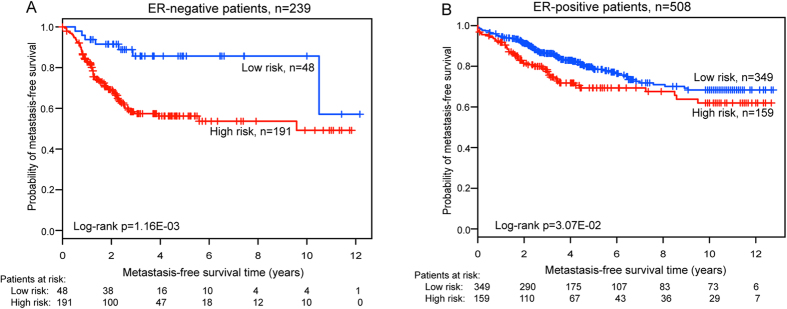
Figure 4. Kaplan-Meier analysis for MFS of breast cancer patients using the nine-lncRNA signature in the subgroups stratified by ER status.
(A) Kaplan-Meier curves for breast cancer patients with ER-negative status (n = 239). (B) Kaplan-Meier curves for breast cancer patients with ER-positive status (n = 508). The differences between the two curves were access by the two-sided log-rank test. The number of patients at risk was listed below the survival curves.

