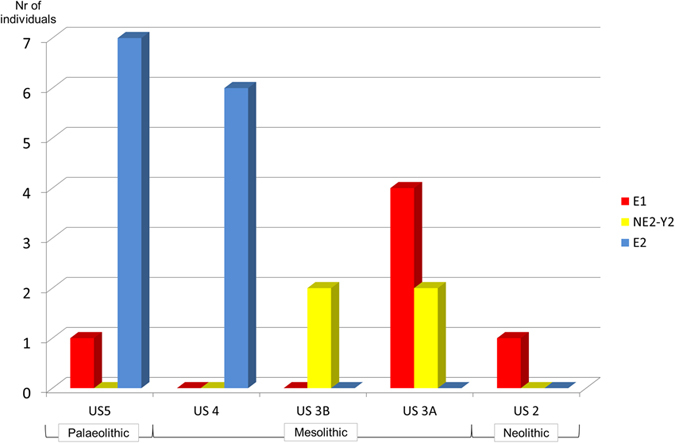
Figure 3. Temporal distribution of mitochondrial haplotypes in Biarzo.

For each stratigraphic unit (x axis) the number of samples with a specific mitochondrial haplotype is reported.

For each stratigraphic unit (x axis) the number of samples with a specific mitochondrial haplotype is reported.