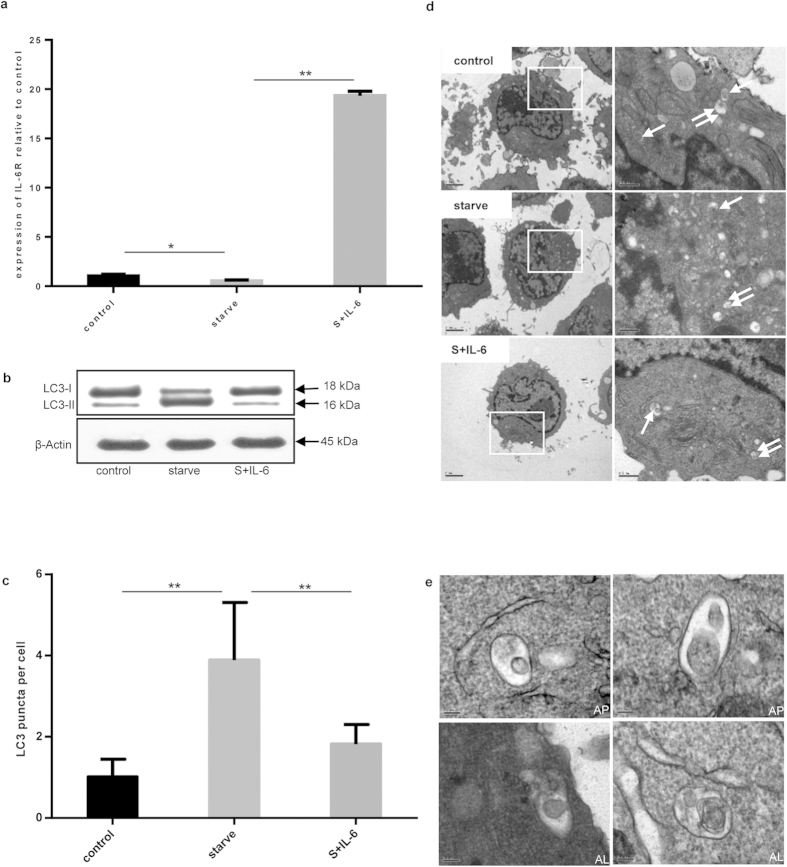
Figure 1. IL-6 inhibited starvation-induced autophagy.
(a) The expression of IL-6R mRNA relative to β-actin was detected under starvation conditions (S) and incubation with or without IL-6 (30 ng/mL) for 2 h. Control versus starve, starve versus S+IL-6; *P < 0.05, **P < 0.01. (b) Immunoblot analysis of LC3 lipidation state. β-actin was used as the loading control. (c) The endogenous LC3 puncta per cell were quantified by immunofluorescence method. Control versus starve, starve versus S+IL-6; **P < 0.01. (d) Autophagosomes (single arrows) and autolysosomes (double arrows) were observed in starvation- or IL-6-treated cells were observed by TEM; Scale bars on the left side photos represent 2 μm and the right side ones represent 0.5 μm. (e) Detailed descriptions of autophagosomes (AP) and autolysosomes (AL); scale bars represent 0.1 μm.

