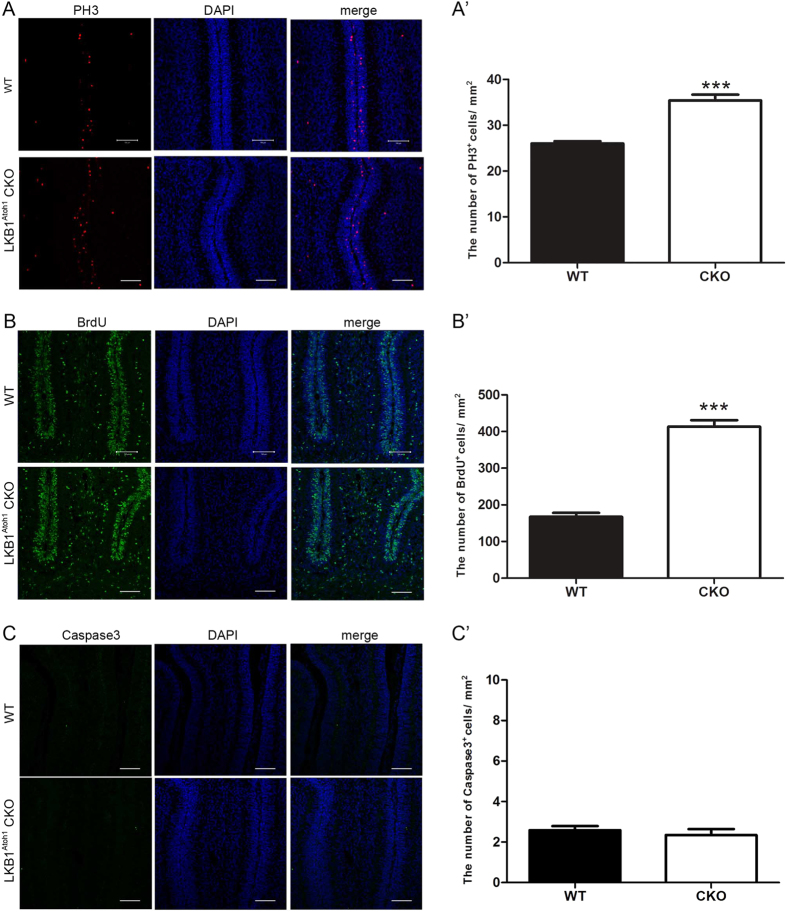
Figure 5. Analysis of GCP proliferation and opoptosis in the LKB1Atoh1 CKO mice.
(A) Sections of P3.5 wild-type and LKB1Atoh1 CKO cerebellum were stained with the anti-PH3 antibody. More PH3+ cells were observed in the mutant cerebellum compared to the wild-type cerebellum, indicating increased GCP proliferation. Red, PH3; Blue, DAPI. Scale bars: 100 μm. (A’) The number of the PH3+ cells per unit size of sagittal sections from the entire cerebellum was quantified in ImageJ (P = 1 × 10 −4). (B) Immunofluorescence of the BrdU pulse (2 hours) in frozen sections of the P3.5 cerebellum. The cerebellar sections were stained with an anti-BrdU antibody, and more BrdU+ cells were observed in the mutant cerebellum compared to the wild-type cerebellum, revealing increased GCP proliferation. Green, BrdU; Blue, DAPI. Scale bars: 100 μm. (B’) The number of BrdU+ cells per unit size of sagittal sections from the entire cerebellum was quantified in ImageJ (P = 3 × 10 −4). (C) Sections of P3.5 wild-type and LKB1Atoh1 CKO cerebellum were stained with anti-caspase3 antibody. No significant change in the number of caspase3+ cells was observed in the mutant cerebellum compared with the wild-type cerebellum. Green, caspase3; Blue, DAPI. Scale bars: 100 μm. (C’) The number of the caspase3+ cells per unit size of sagittal sections from the entire cerebellum was quantified in ImageJ. No significant change in the number of caspase3+ cells were found in the mutant cerebellum compared with the wild-type cerebellum (P = 0.53). The error bars indicate the SEM. *P < 0.05; **P < 0.01; ***P < 0.001 compared to the WT by Student’s t-test; n = 4 animals for each group.

