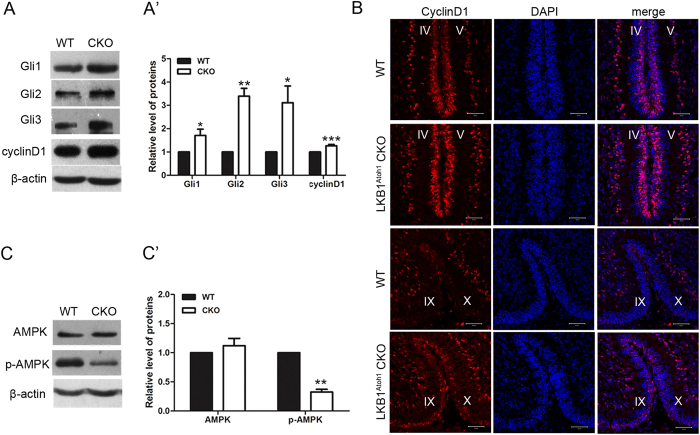
Figure 8. Expression levels of Glis, cyclinD1 and AMPK proteins.
(A) Western blots of the cerebellum showed that the Gli1, Gli2, Gli3 and cyclinD1 proteins were significantly increased in the P3.5 LKB1Atoh1 CKO cerebellum (CKO), compared to the controls (WT). (A’) Quantification of the Western blot results for the Gli1, Gli2, Gli3 and cyclinD1 proteins. The data were normalized against the results of the wild-type (PGli1 = 0.03; PGli2 = 0.002; PGli3 = 0.04; PCyclinD1 = 4.9 × 10 −4). (B) Immunofluorescence of cyclinD1 in P3.5 wild-type and LKB1Atoh1 CKO cerebellum. The sections were stained with an anti-cyclinD1 antibody and imaged in folia IV/V and IX/X. The number of cyclinD1+ cells in the mutant cerebellum were increased compared to the control. Red, cyclinD1; Blue, DAPI. Scale Bars: 50 μm. (C) Western blot analysis of AMPK and phosphorylated AMPK (pAMPK) in the P3.5 cerebellum. There was no obvious change in the total AMPK protein, while the level of pAMPK was significantly reduced in the mutant cerebellum compared to the controls. (C’) Quantification of the Western blot results for the AMPK and pAMPK proteins. The data were normalized against the results of the wild-type (PAMPK = 0.3; PpAMPK = 2 × 10 −3). The error bars indicate the SEM. *P < 0.05; **P < 0.01; ***P < 0.001 compared to the WT by Student’s t-test; n > 4 animals for each group.

