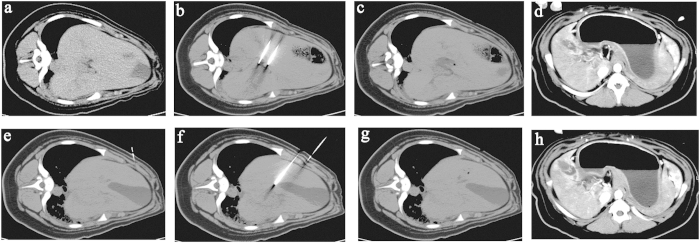
Figure 2. CT scan before and after treatment.
The upper four CT scans are the liver before treatment (a), the two-needle electrodes inserted in the hilus hepatic (b), 2 hours after treatment (c) and 24 hours after treatment (d). The lower four CT scans are the gall bladder before treatment (e), the two-needle electrodes inserted near the neck of the gall bladder (f), 2 hours after treatment (g) and 24 hours after treatment (h). The CT images demonstrated a clear hypoattenuating area with a hyperattenuating rim in the ablated area.

