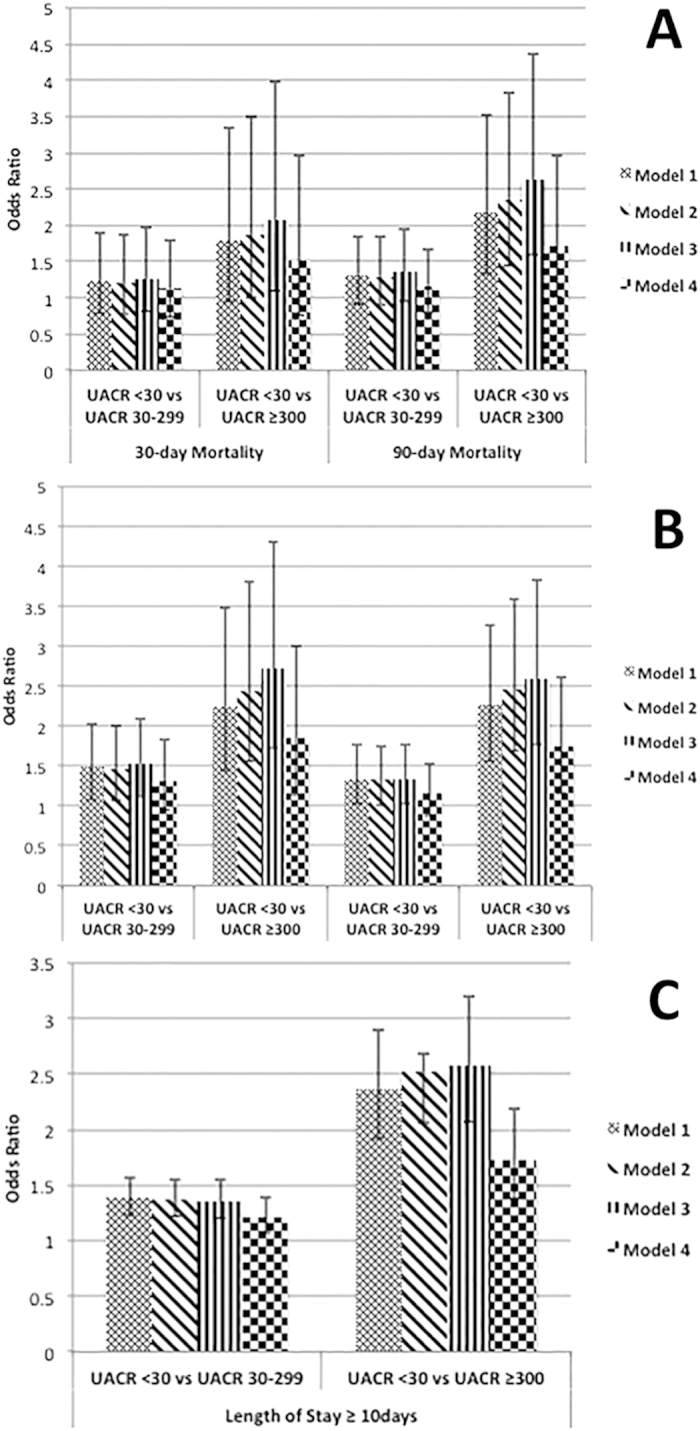
Figure 2. Association of UACR level with outcomes in different levels of adjustment.

(Panel A) for 30- and 90-day mortality, (Panel B) for 180- and 365-day mortality and (Panel C) Length of hospital stay. Model 1 – unadjusted; Model 2 – model 1 adjusted for age, gender, race/ethnicity; Model 3- model 2 adjusted for SBP, DBP, Preoperative ACE inhibitor and statin use, In-hospital ACE inhibitor and statin use; Model 4 – model 3 adjusted for eGFR, cholesterol, DM, CHF, CCI. All displayed as odds ratio and 95% confidence interval.
