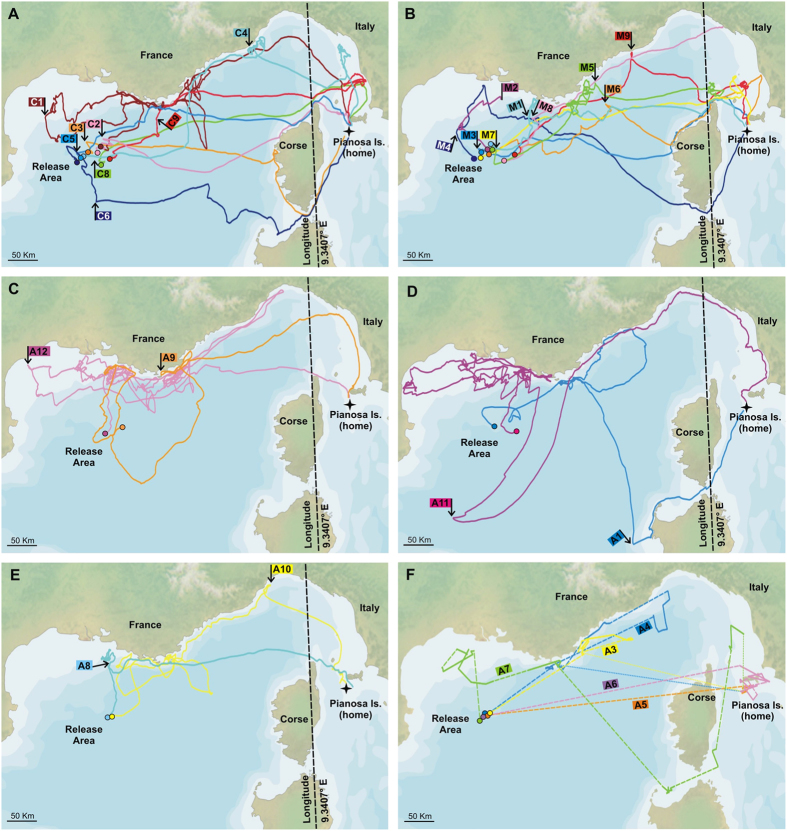
Figure 1. Homing paths of the shearwaters over a Natural Earth map (.
http://www.naturalearthdata.com). In the panels reporting the GPS tracks the longitude delimiting the section of the tracks analysed for the propensity of the birds to fly near or far from the coast (see methods for details). For each track the circle represents the release point; when present, the arrow at the basis of the flag reporting the individual code represents the decision point (see text for details). Panel (A) GPS tracks of Control birds. Panel (B) GPS tracks of Magnetic birds. The flag of M2 is placed at the end of the interrupted track; the decision point has not been determined because this track is too short. Panel (C–E) GPS tracks of Anosmic birds. Panel (F) PTT tracks of Anosmic birds. Broken lines represent the beeline between the last fix of a recording session and the first fix of the following recording session. Dotted lines represent the beeline between the last fix recorded and home.

