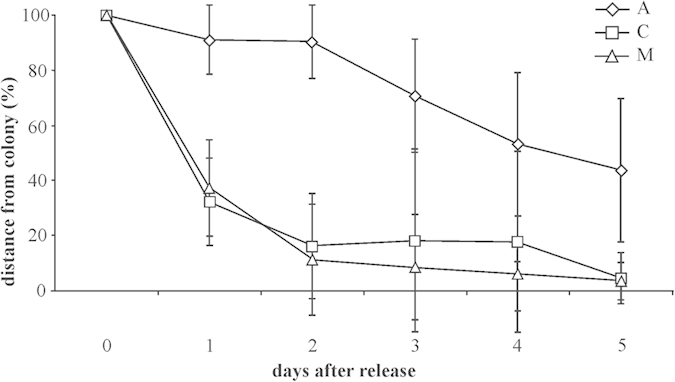
Figure 2.

Mean distance from the colony, expressed as percentage of the distance at the release site, of the three groups of shearwaters (C, controls n = 8; M, birds bearing mobile magnets, n = 8; A, anosmic birds n = 11) from the time of release (indicated with 0) up to day 5 after release. The bars represent the 95% confidence limits.
