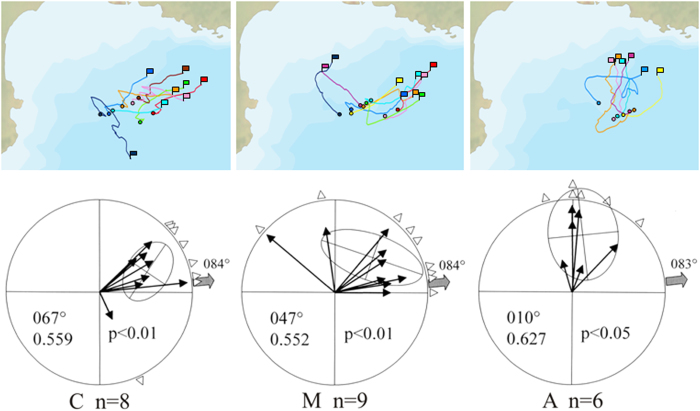
Figure 3.
Sections of the tracks (colours as in Figure 1) from the release point (circle) up to 60 km away from it (flag) and the relative diagrams reporting their orientation: C, control birds, n = 8; M, birds bearing magnets n = 9; A, anosmic birds, n = 6. Each mean vector indicates the mean orientation of a bird’s track. The mean vector distributions are tested for randomness with the Hotelling test (95% confidence ellipses are reported). Triangles at the periphery of the circles represent the tracks’ mean directions. The grey arrow indicated the mean home direction for each experimental group. Second order mean vector length and direction are reported.

