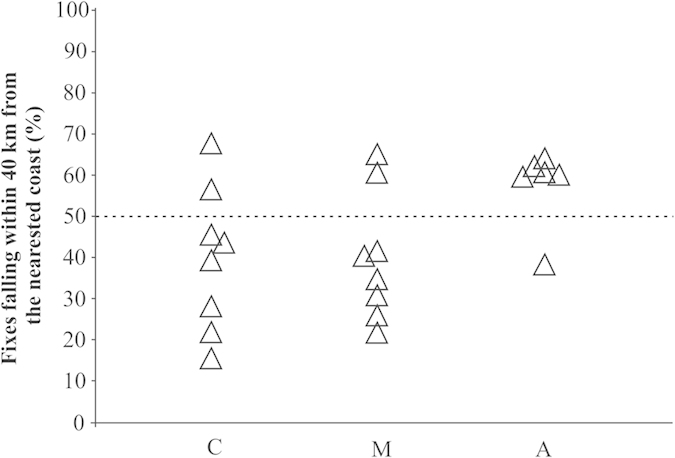
Figure 5. Each triangle represents the percentage of fixes of each track falling within 40 km from the nearest coast.

C, control birds n = 8; M, birds bearing magnets n = 8; A, anosmic birds, n = 6. The birds with a percentage greater than 50% were assigned to the category “near”, the other ones to the category “far” (see text).
