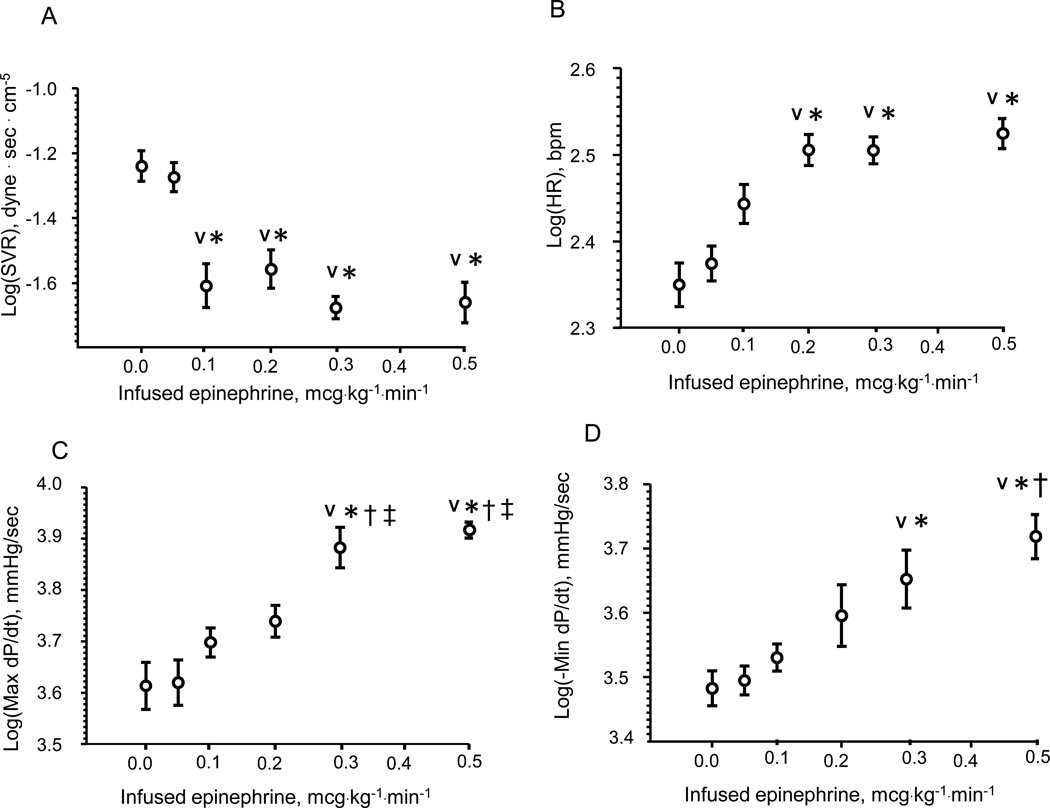
Figure 1.
Hemodynamic dose response to epinephrine IV infusions in terms of systemic vascular resistance (SVR) (Panel A) heart rate (HR) (Panel B), contractility (max dP/dt) (Panel C) and lusitropy (min dP/dt) (Panel D). Each dose produces a unique hemodynamic response. The lowest dose did not elicit any hemodynamic response. SVR was significantly lowered starting at 0.1 mcg · kg −1· min −1 and heart rate increased at 0.2 mcg · kg −1· min −1 infusion rate. Max dP/dt and min dP/dt were were first increased above baseline at 0.3 mcg · kg −1· min −1. Data are presented as log-transformed to the base of 10. N=6, AVG ± SD.
V - < 0.05 – compared with 0.00 mcg · kg −1· min −1 infusion rate,
* - < 0.05 – compared with 0.05 mcg · kg −1· min −1 infusion rate,
† - < 0.05 – compared with 0.1 mcg · kg −1· min −1 infusion rate,
‡ - < 0.05 – compared with 0.2 mcg · kg −1· min −1 infusion rate.

