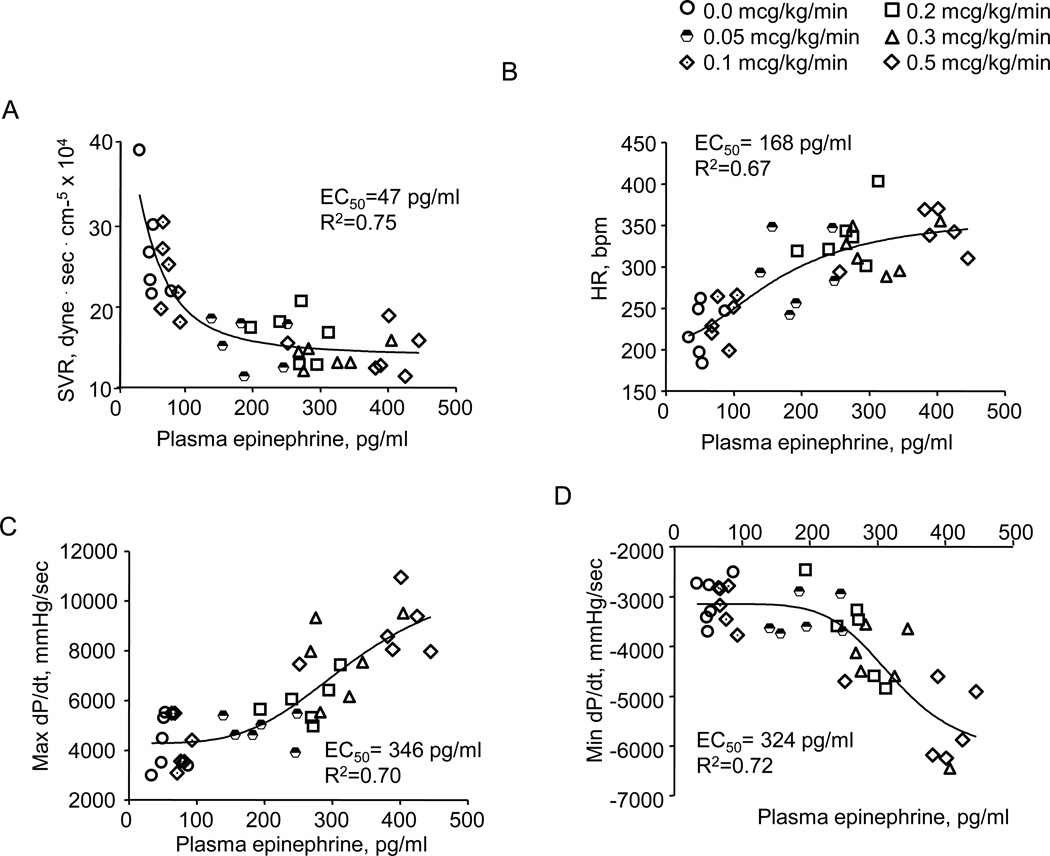
Figure 3.
Effect of plasma epinephrine content on systemic vascular resistance (SVR) (Panel A), heart rate (HR) (Panel B), max dP/dt (Panel C) and min dP/dt (Panel D). Data are fit to sigmoidal curves (Prism 5.0, Graph Pad). These correlations suggest that vascular effects occur at the lowest plasma epinephrine levels, HR increases at a significantly higher plasma level and contractile effects emerge at the highest plasma concentrations, such that the concentration where each effect half maximal (EC50) is: EC50 SVR < EC50 HR < EC50 max dP/dt and EC50 min dP/dt.

