Figure 5.
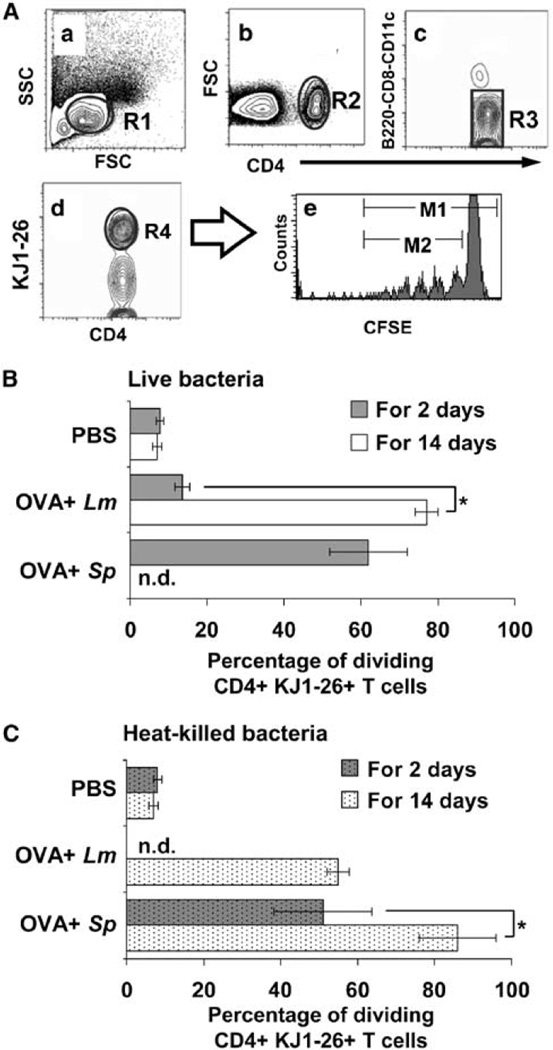
L. murinus primes OVA-specific T cells less efficiently than S. pyogenes. (A) Flow cytometry example of contour plots of splenocytes from mice inoculated intranasally with L. murinus for 9 days. (a) R1 identifies lymphocytes in forward and side scatter plot. (b) Subgate of R1 identifies CD4+ leukocytes (R2). (c) Subgate of R2 excludes B cells, CD8 T cells, CD11c+ CD4+ DCs, and potential circulating double-positive lymphocytes. (d) Subgate of R3 identifies the percentage of OVA-specific T cells (R4) out of total lymphocytes (R1). (e) Subgate of R4 identifies the percentage of dividing OVA-specific T cells when the ratio of cells diluting their 5-(and-6)-carboxyfluorescein diacetate succinimidyl ester (CFSE) in the M2/M1 gates×100 is calculated. (B, C) Percentage of dividing CD4+ KJ1-26+ T cells in spleen 21 days after initial intranasal inoculation with phosphate-buffered saline (PBS), 2×10⁹ OVA+ L. murinu s or 2×10⁸ OVA+ S. pyogenes for 2 days (gray bars) or 14 days (white bars). To avoid septicemia, S. pyogenes was heat killed at 65 °C for 1 h before the inoculation for 14 days. Data shown are averages±s.e.m. from three experiments (n = 6 mice per data point). T-cell proliferation was significantly greater (P < 0.05) in each treatment group when compared to PBS control (* P < 0.05; Student’s t-test).

