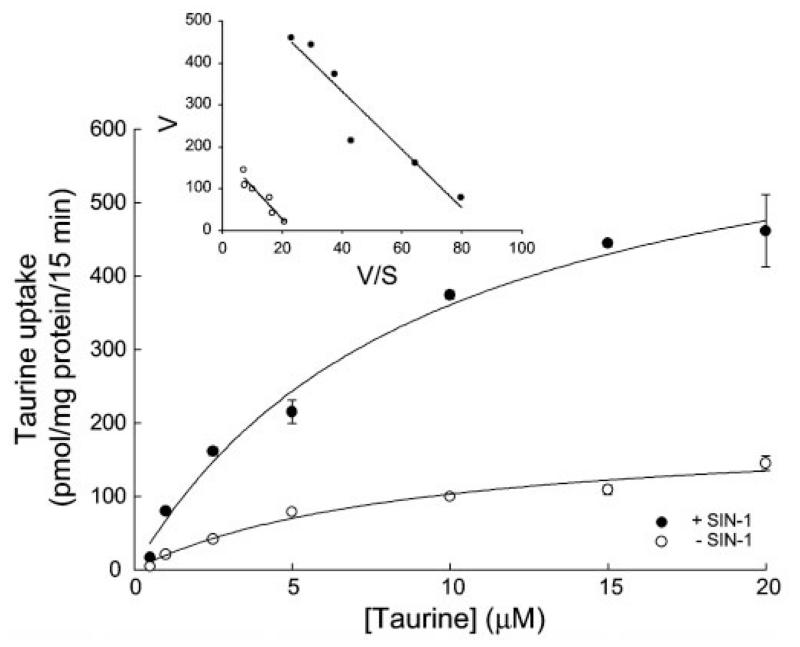
Fig. 7.
Kinetic analysis of taurine uptake in control and SIN-1-treated ARPE-19 cells. Confluent cells were treated with or without 1 mM SIN-1 for 24 h. Uptake of taurine was measured for 15 min over a taurine concentration range of 0.5–20 μM. Values are means ± SE for 3 determinations from 3 independent experiments. Results are presented as plots describing the relationship between taurine concentration and taurine uptake rate and also as Eadie-Hofstee plots: V/S vs. V, where V is taurine uptake (in pmol·mg protein−1·15 min−1) and S is taurine concentration (in μM).

