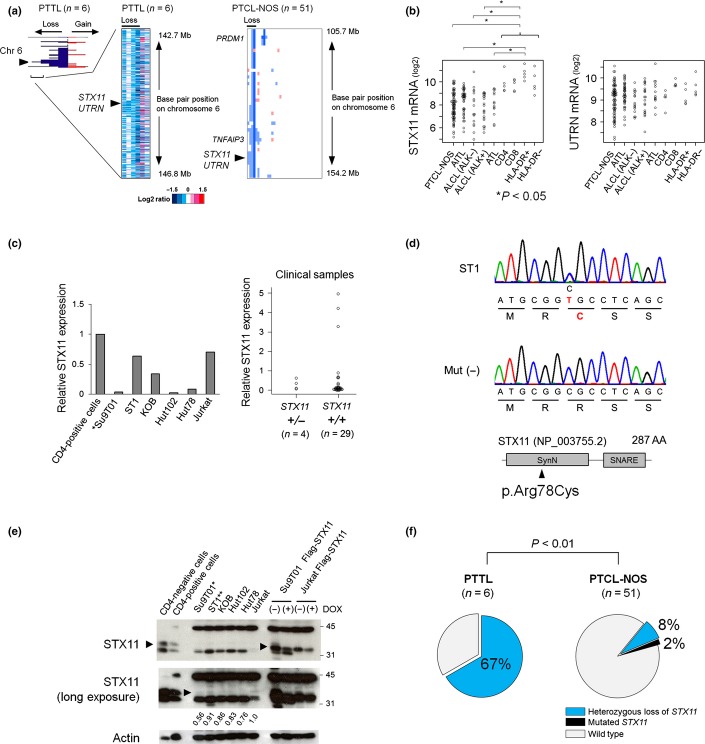
Figure 1.
Status of STX11 in primary thyroid T-cell lymphoma (PTTL) and peripheral T-cell lymphomas (PTCL)-NOS genomes. (a) The horizontal axis indicates the frequency of chromosome 6 alterations in PTTL cases (left). Red and blue areas represent genomic gains and losses, respectively. Heat map analyses showing log2 ratios of PTTL (middle) and PTCL-NOS (right) tumor cells relative to normal controls. White, blue and red represent genomic diploids, losses and gains, respectively. Arrowheads indicate the STX11/UTRN locus. Data of PTTL were modified from our previous study.17 (b) The expression levels of STX11 and UTRN, genes contained within the minimal common region (MCR), were determined using published data (GSE6338 and GSE19069). The data included PTCL-NOS (n = 78), angioimmunoblastic T-cell lymphoma (AITL; n = 43), anaplastic lymphoma kinase (ALK)-negative anaplastic large cell lymphoma (ALCL, n = 16), ALK-positive ALCL (n = 20) and adult T-cell leukemia/lymphoma cases (ATL; n = 13), as well as CD4-positive T-cells (n = 5), CD8-positive T-cells (n = 5), HLA-DR-positive T-cells (n = 5) and HLA-DR-negative T-cells (n = 5). Significant differences were observed in each pair (*P < 0.05, one way-analysis of variance, Tukey’s correlation). (c) STX11 expression levels in PTCL were normalized to β-actin and compared to that of healthy donor CD4-positive cells. Relative expression is shown. (Left) STX11 expression in T-cell lines was lower than in normal CD4-positive T-cells. Genomic loss of STX11 is indicated (*). (Right) Four PTCL-NOS and PTTL cases carrying genomic alterations of STX11 and 29 cases without STX11 alterations were analyzed. (d) DNA sequencing chromatogram of a T-cell line (ST1) showing a missense mutation in STX11 (p. Arg78Cys, c.232C>T; upper panel). A representative sample that did not carry the mutation is shown in the middle panel. The lower panel shows a schematic representation of the STX11 protein, depicting the location of the syntaxin N-terminus (SynN) and SNAP receptor (SNARE) domains. The arrowhead indicates the position of the mutation. (e) Western blot analysis of STX11 and β-Actin in normal CD4-positive and CD4-negative cells, and six T-cell lines. To detect STX11, we introduced Flag-STX11 into Jurkat and Su9T01 cells using the Tet-OFF system. Western blots of induced STX11 probed with anti-STX11 antibody are shown in the four lanes to the right. In this system, STX11 is expressed in response to doxycycline (DOX) removal (see also Suppl. Fig. S1c). The arrowheads mark STX11 protein signals. The middle panel shows a longer exposure of the same membrane. Signals were converted to a numerical value by using the ImageJ software. The ratio of STX11 to actin expression was calculated and displayed below each lane. The STX11/actin ratio in Jurkat cells is used as a control. Heterozygous genomic loss and heterozygous missense mutation of STX11 are indicated by * and **, respectively. (f) Genomic loss of the STX11 region was observed in 67% of PTTL cases (n = 6), whereas 10% of PTCL-NOS cases (n = 51) showed genomic losses and mutations of STX11 (P < 0.01, Fisher’s exact test). Synonymous mutations were excluded from the analysis.

