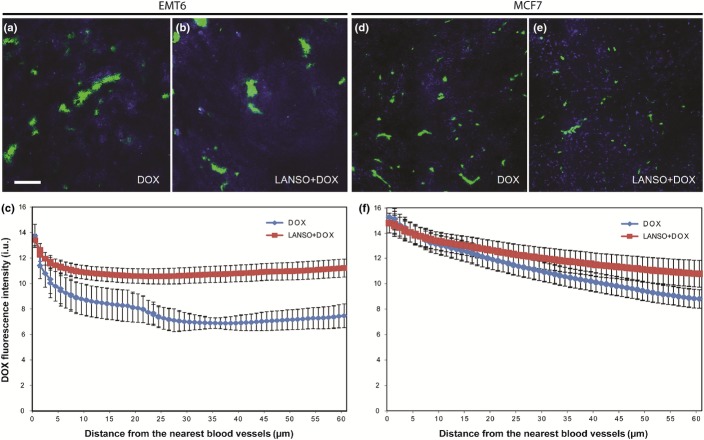
Figure 4.
Distribution of doxorubicin fluorescence intensity in relation to blood vessels in EMT6- and MCF7-derived tumors. Mice were given either 25 mg/kg doxorubicin alone ((Dox; 10 min) (a, d) or 200 mg/kg lansoprazole (2 h before doxorubicin) and doxorubicin (Dox+Lanso) (b, e) prior to tumor excision. Tumors were imaged and quantified using a customized algorithm to show the mean absolute (background-subtracted) values of doxorubicin fluorescence intensity (blue) as a function of distance to the nearest functional blood vessel (green) (c, f). Scale bar = 100 μm.

