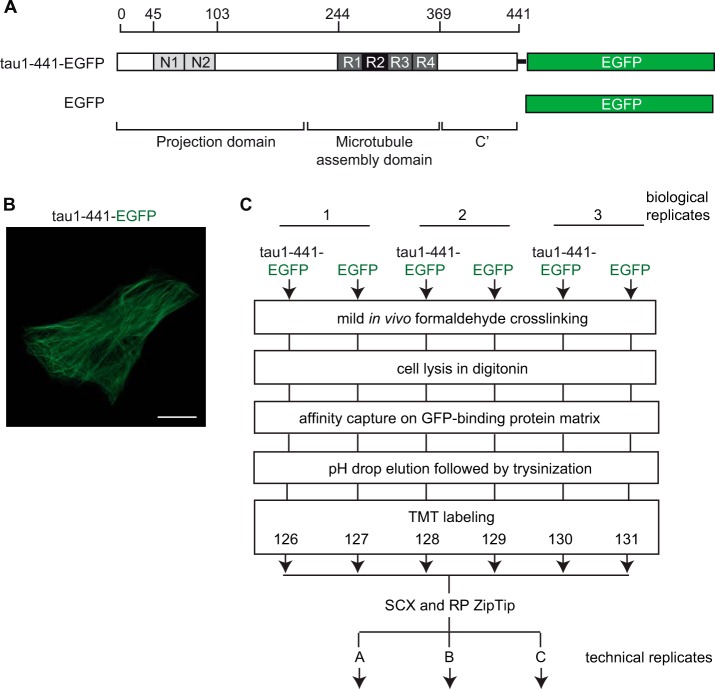
Fig. 1.
Schematic presentation of bait proteins, expression analysis and workflow of tau interactome experiment. A, Tau1–441-EGFP fusion construct employed in this work. B, Live-cell fluorescence image of tau1–441-EGFP expression in CV-1 cells. Scale bar = 1 μm. C, Workflow for identifying tau interactors in human SH-SY5Y neuroblastoma cells.

