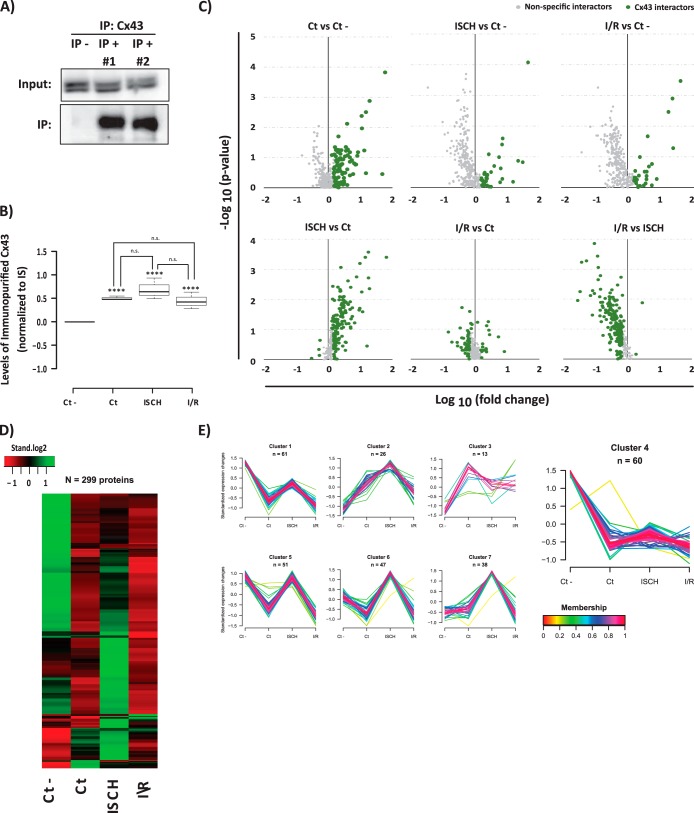
Fig. 1.
AP-SWATH approach for the study of the dynamic interactome of Cx43 in heart. A, Immunoblotting detection of the immunopurified Cx43 (Cx43 IP versus control IP). B, SWATH quantification of Cx43 IP in each condition. Data are presented as boxplots of the normalized values to internal standard (IS). Student t test was applied. ****ρ <0.001; “n.s.” (no statistical difference). C, Volcano plots showing log10 fold change plotted against -log10 p value for all the 299 quantified proteins in Cx43 IP samples versus samples generated from an irrelevant bait (GFP) (upper panel), and between the three Cx43 IPs (lower panel). Data points highlighted in green represent the proteins that met one of the following criteria: a p value < 0.1; a 50% increase (log10 fold change >1.5) when compared with control IP, or 50% change among two Cx43 IPs. Highlighted proteins correspond to the 236 putative Cx43 interacting partners. D, Heat map showing the levels of the copurified proteins among conditions. The row-clustered heat map represents the standardized median levels for all the 299 quantified proteins. E, Clustering of all the proteins copurified in the IPs. For the 299 proteins quantified the normalized levels were standardized and proteins were subjected to unsupervised clustering. An upper and lower ratio limit of log2 (2) and log2 (0.5) was used for inclusion into a cluster. “n” indicates the number of proteins within each cluster. Membership value represents how well the protein profile fit the average cluster profile. Highlighted Cluster 4 corresponds to the nonspecific Cx43 interactors.

