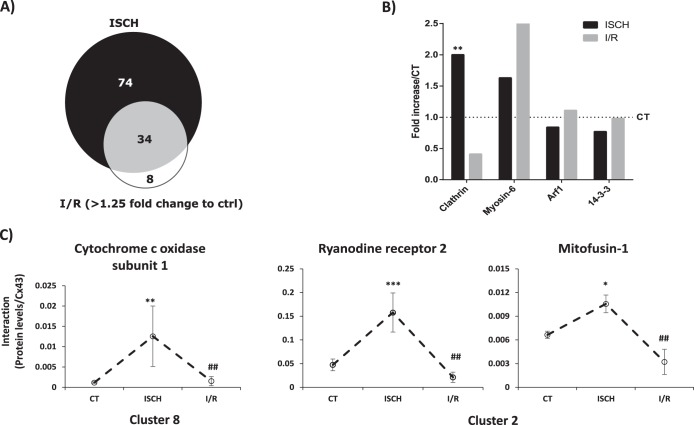
Fig. 4.
Cx43 interactions Categorized by Functional Group. A. Proportional Venn diagram comparing the Cx43-interactors associated with metabolism found up-regulated in ISCH and I/R. (B). Graph depicts the quantification of the interaction between different traffic-related proteins and Cx43 in ISCH and I/R (represented as fold increase/CT). C, Individual profiles of the interaction of Cx43 with proteins involved in calcium signaling and metabolism validated in this studies (see Figs. 5 and 6). Data are presented as media±MAD of the interaction levels for three independent experiments. The respective cluster is indicated below the graphs. *ρ<0.1, ** ρ<0.05, *** ρ<0.01 (versus control condition). # statistical difference between ISCH and I/R conditions.

