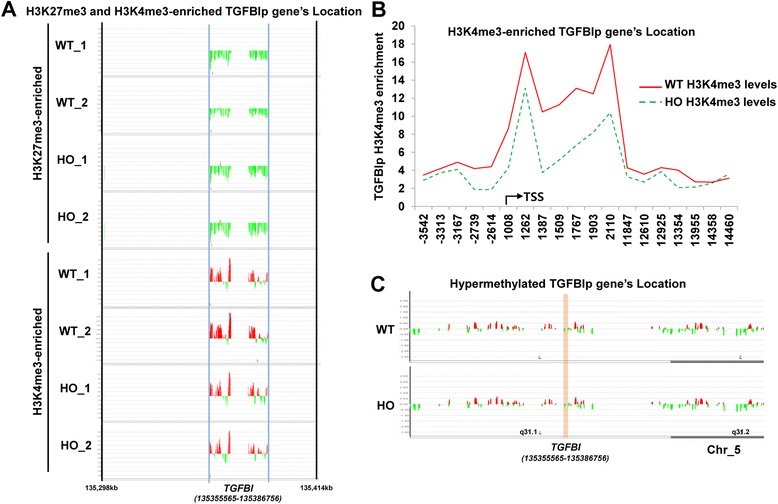
Fig. 2.

H3K4me3 and H3K27me3 levels in wild-type cells compared with those in GCD2-homozygous primary corneal fibroblasts. a Heat map of ChIP-chip signal for two wild-type and two GCD2-homozygous primary corneal fibroblasts. b Heat map of the H3K4me3-enriched TGFBIp gene location in wild-type and GCD2 primary corneal fibroblasts. Each line represents the average H3K4me3 levels in each cell type. A continuous X-axis indicates the location from the promoter region to downstream of the TGFBI gene. c Heat map of methylated DNA and CpG island regions of the TGFBIp gene in primary corneal fibroblasts
