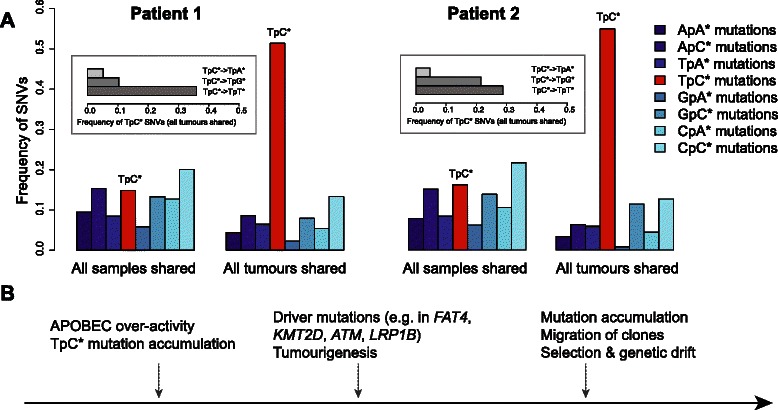
Fig. 2.

a SNV frequencies in dinucleotide context. Frequencies are compared between SNVs among all SNVs shared among all 4 samples (n = 842–1059), and SNVs shared among all 3 tumours (n = 428–473). Asterisks indicate which base is mutated; e.g. TpC* stands for TpC- > TpA, TpC- > TpG, or TpC- > TpT. Inset shows the frequency of substitutions in all tumours at TpC* sites. We only consider A or C mutations in either strand and their 5’ nucleotides, following [9]. b Proposed development of the bladder cancer lesion from initiation of transformation to migration of the clonal tumours
