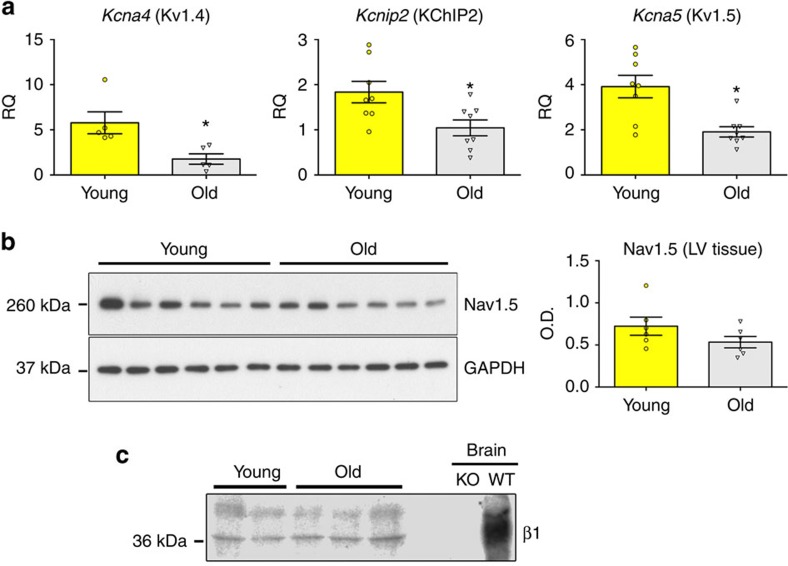
Figure 10. Aging and the expression of transcripts and proteins for K+ and Na+ channel subunits.
(a) Quantitative data for the expression of genes related to channels mediating Ito (Kcna4, Kcnip2) and IK,slow1 (Kcna5) in myocytes from mice at 3–4 months (Young, n=5–8) and 27–33 months (Old, n=5–8) are shown as mean±s.e.m. and scatter plots. RQ, relative quantity with respect to β-2-microglobulin; *P<0.05 versus Young (Student's t-test and Mann–Whitney rank sum test); NP, non-parametric analysis. (b) Expression of the Na+ channel protein subunit Nav1.5 by western blotting in the LV myocardium of mice at 3–5 months (Young, n=6) and 28 months (Old, n=6). GAPDH is the loading condition. Quantitative data are reported as mean±s.e.m. and scatter plots. (c) Expression of Na+ channel β1 subunit protein by western blotting in the LV myocardium of mice at 3–4 months (Young) and 30–31 months (Old). β1 levels in the brains of Scn1b null (KO) and wild-type (WT) mice were used as negative and positive controls, respectively. A total of 150 μg of LV protein lysate per lane and 25 μg of brain membrane protein per lane were loaded.

