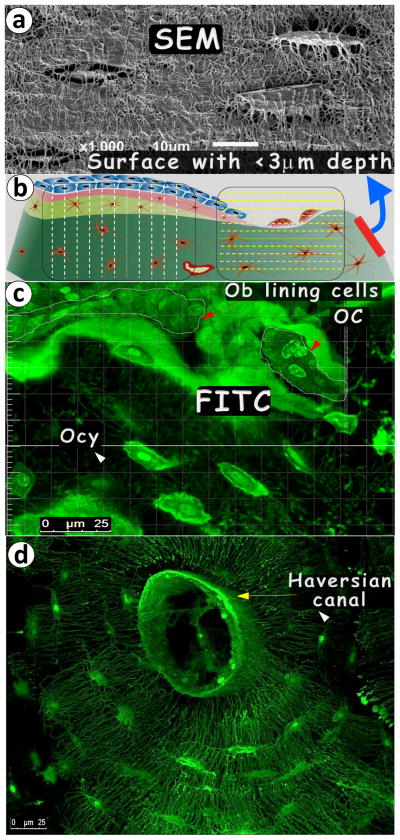
Fig. 1. Pros and cons of acid-etched SEM and FITC techniques in imaging bone cells.
(a). Acid- etched, high-resolution SEM image displayed resin-casted osteocyte (Ocy)-canalicular system on the bone surface; (b). The diagram reveals the difference between the SEM and FITC imaging techniques with the former showing mineral- buried Ocy on the surface only and the latter technique imaging cells from the bone surface to inside the bone to a depth up to >50 mm with any region, angle or direction interested; (c). An example of an FITC image of the 6-mon-old rat tibia cortical bone revealing osteocyte (Ocy), osteoblast (Ob) lining cells, and osteoclast (OC); and (d). An example of a FITC-osteon image of the 30-year-old femur cortical bone showing the Ocy-dendritic system surrounding the Haversian canal.

