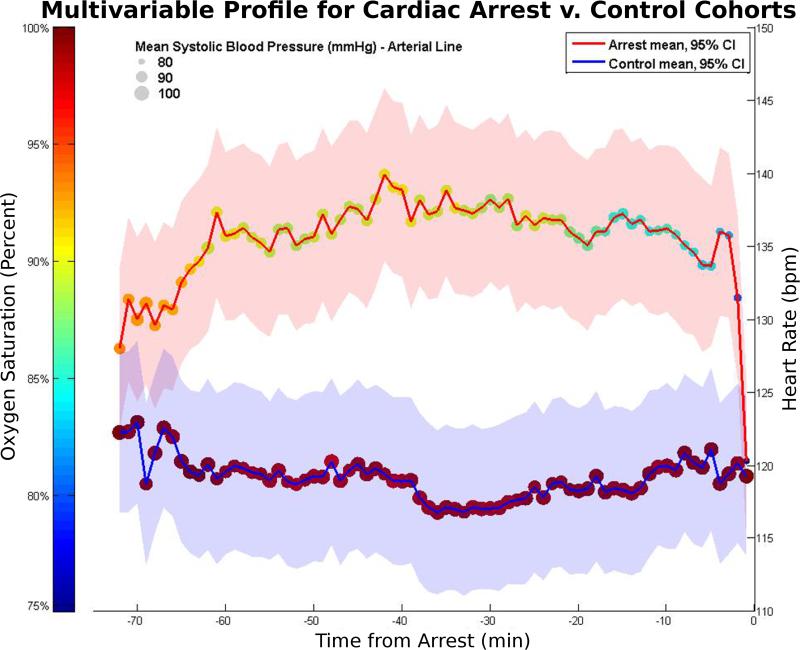
Figure 2.
Mean values for heart rate (position on y-axis with shaded 95% SEM), oxygen saturation (dot color), and systolic blood pressure (dot size) are shown for arrest (red line) and control (blue line) subjects over the span of 12 hours. Left to right, the first 12 values represent hourly averages, and the last 60 values represent minute-by-minute measurements. Heart rate indicators occurred very close to the arrest event (acute drop 1-2 minutes beforehand). Pulse oximetry and blood pressure indicators started noticeable trends downward at 15-20 minutes beforehand.

