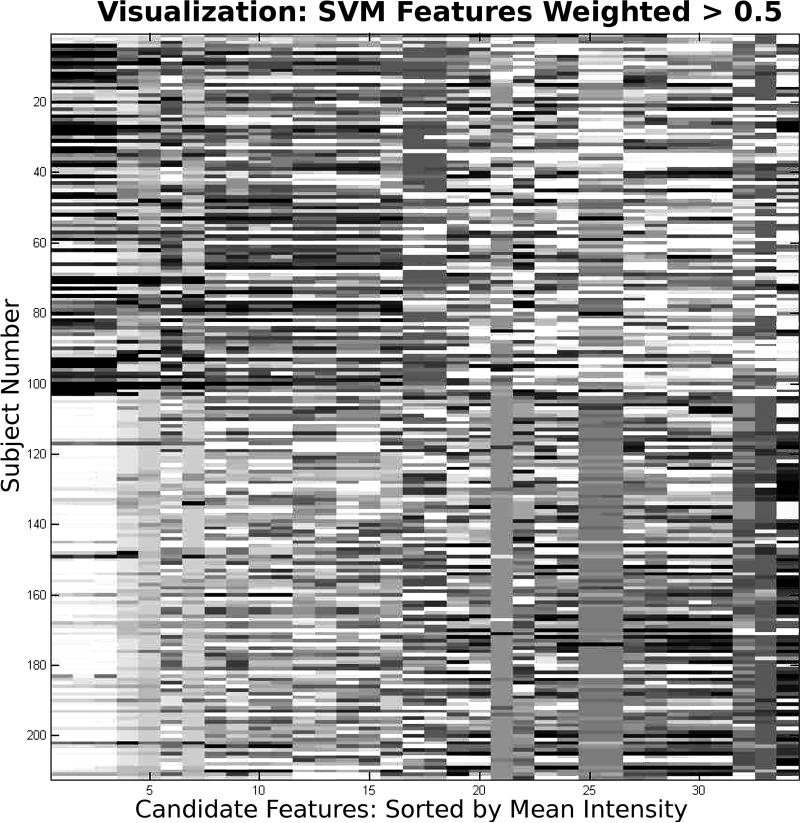
Figure 4.
Top 35 variables determined by support vector machine weighting. The columns are arranged in descending order of mean variable intensity of the arrest cases. However, the order does not reflect the weight of the variable in predicting arrest. Visually, the first four variables are highly correlated, and represent SPO2 values preceding the arrest: at t minus 1,2,7, and 10. These raw SPO2 values did not rank in the top 5 weights, but two of the top five weights were trend calculations involving SPO2: 5 minute intercept, and 60 minute slope. Visually, arrest cases tend to transition from dark to light, whereas control cases tend to transition from light to dark.

