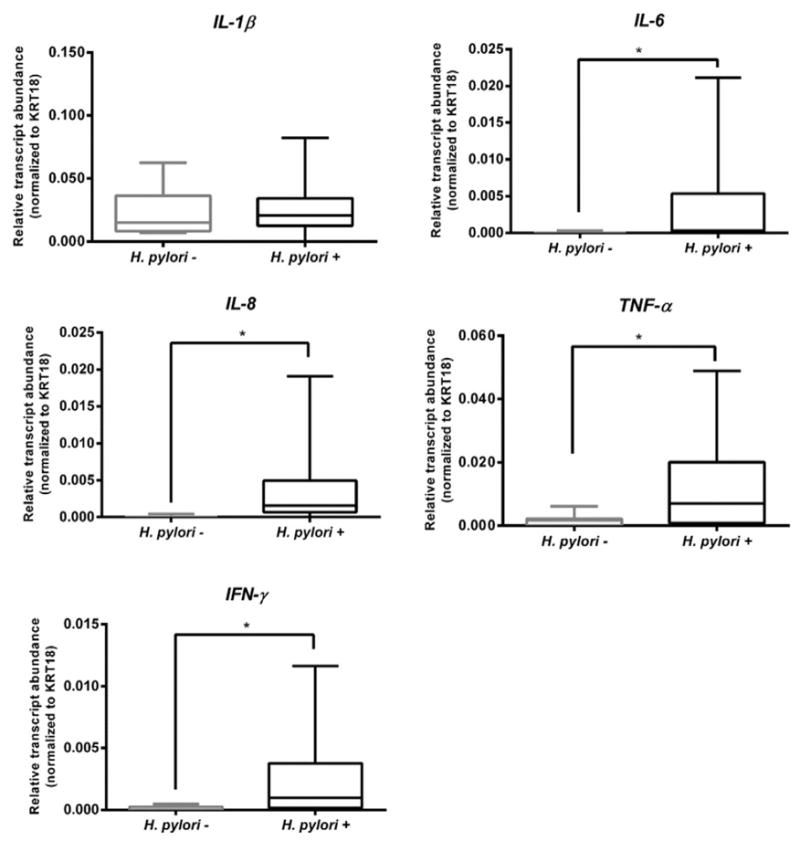
Fig. 3.

Gastric mucosal local transcript levels of inflammatory markers. qRT-PCR analysis of IL-1β, IL-8, IL-6, TNF-α and IFN-γ genes. The box and whisker plots represent relative gene transcript abundance for each biological group including the minimum and maximum values and the median. qRT-PCR reactions were performed in triplicate and relative transcript abundance of the target gene was normalized to KRT18 expression levels. Statistical significance determined using unpaired t-test with Welch correction.*p < 0.05.
