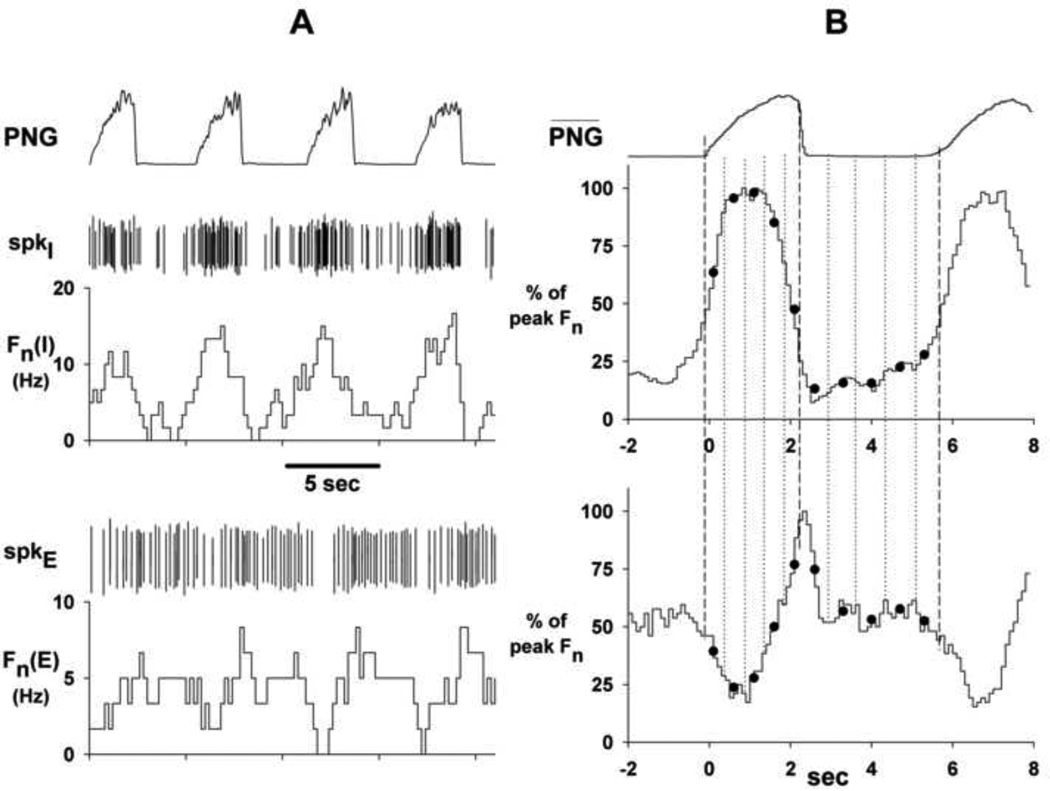
Figure 1.
Two examples illustrating data preparation for the clustering procedure. Panel A: spike activity (CED Spike2 wavemark signals) and corresponding rate meter recordings of an I (upper) and E (lower) PRG neuron. Panel B: Corresponding CTHs and time-averaged phrenic neurogram (PNG-bar; 31 cycles). Dots: 5 temporally equidistant values during I-phase and 5 during the E-phase are selected for each vector representation of neuronal pattern. Time zones are indicated by the vertical dashed and dotted lines. See text for more details.

