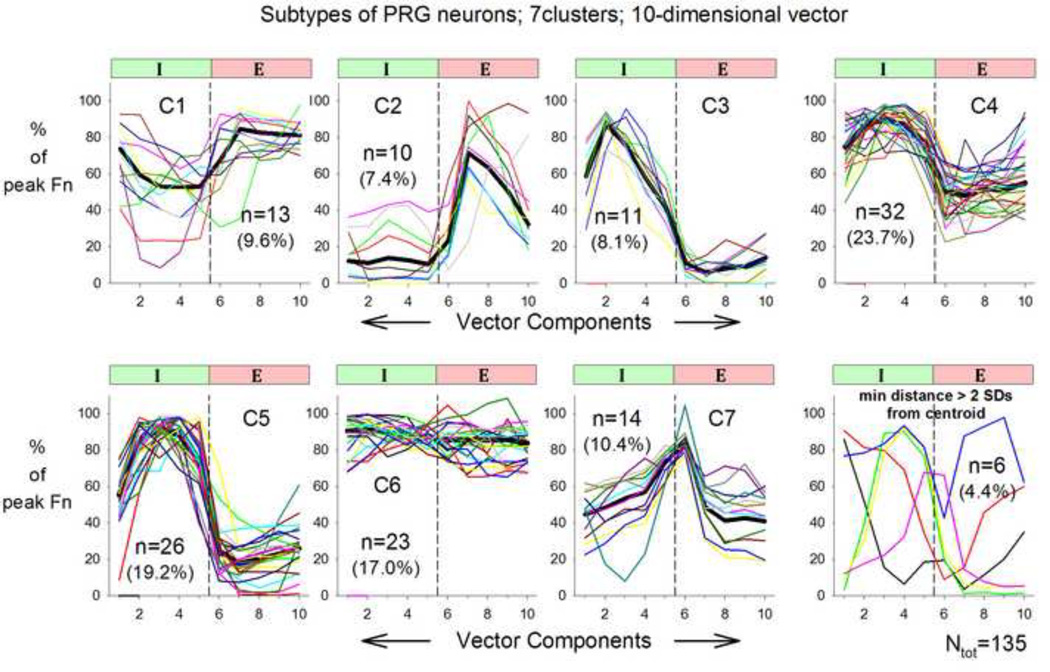
Figure 3.
Results of the clustering procedure: Traces of individual neuron patterns are superimposed on the centroids (thick lines) that resulted in the smallest overall error. Number of neurons in each cluster and percentage (%)/cluster are indicated for clusters C1-C7. Lower right panel: patterns that did not fit well with any of the 7 clusters.

