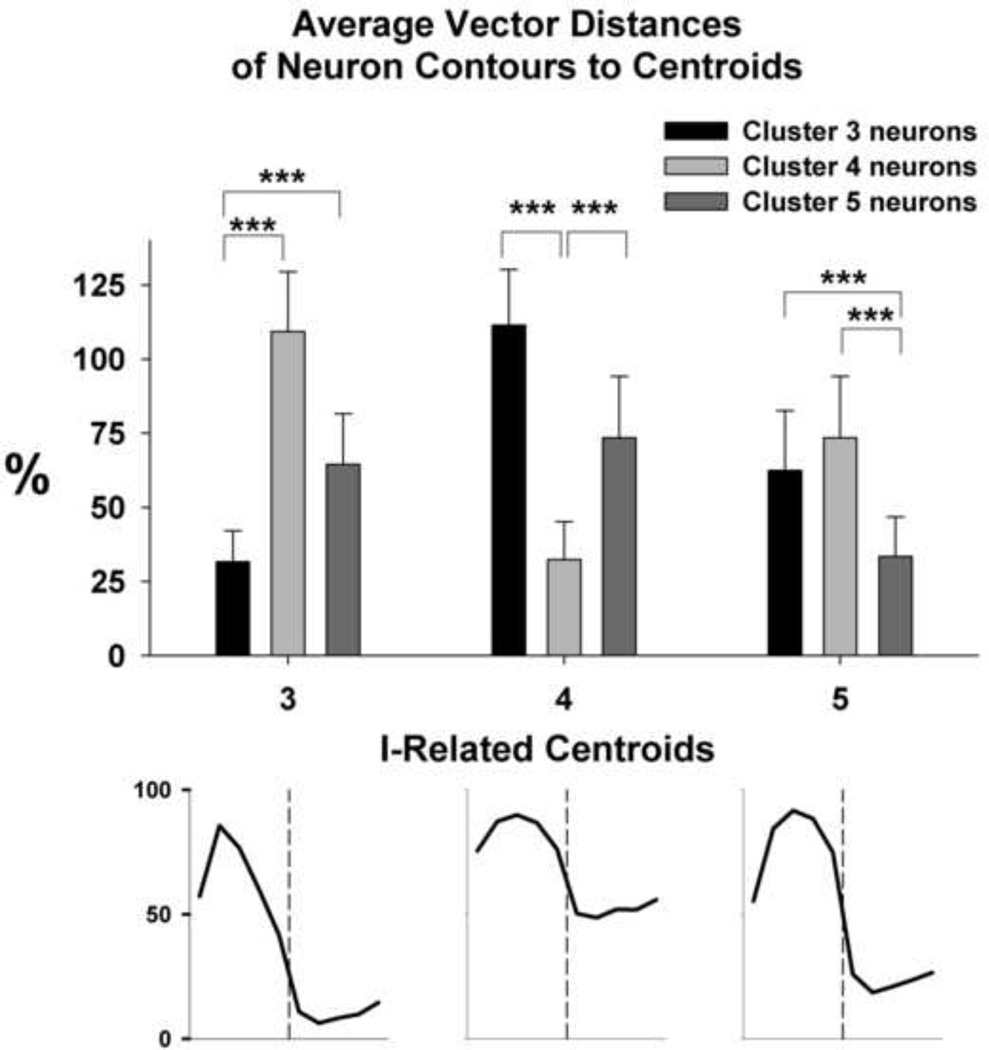
Figure 4.
Degree of separation in vector distances (D) of neurons assigned to one centroid compared to distances of those neurons to other similar centroids is shown. E.g., the average D of cluster 3 neurons to centroid 3 (black bar, left panel) is significantly different from the average Ds for neurons assigned to clusters 4 and 5 to centroid 3. ***: p<0.001. Vertical dashed lines: I-E transition point.

