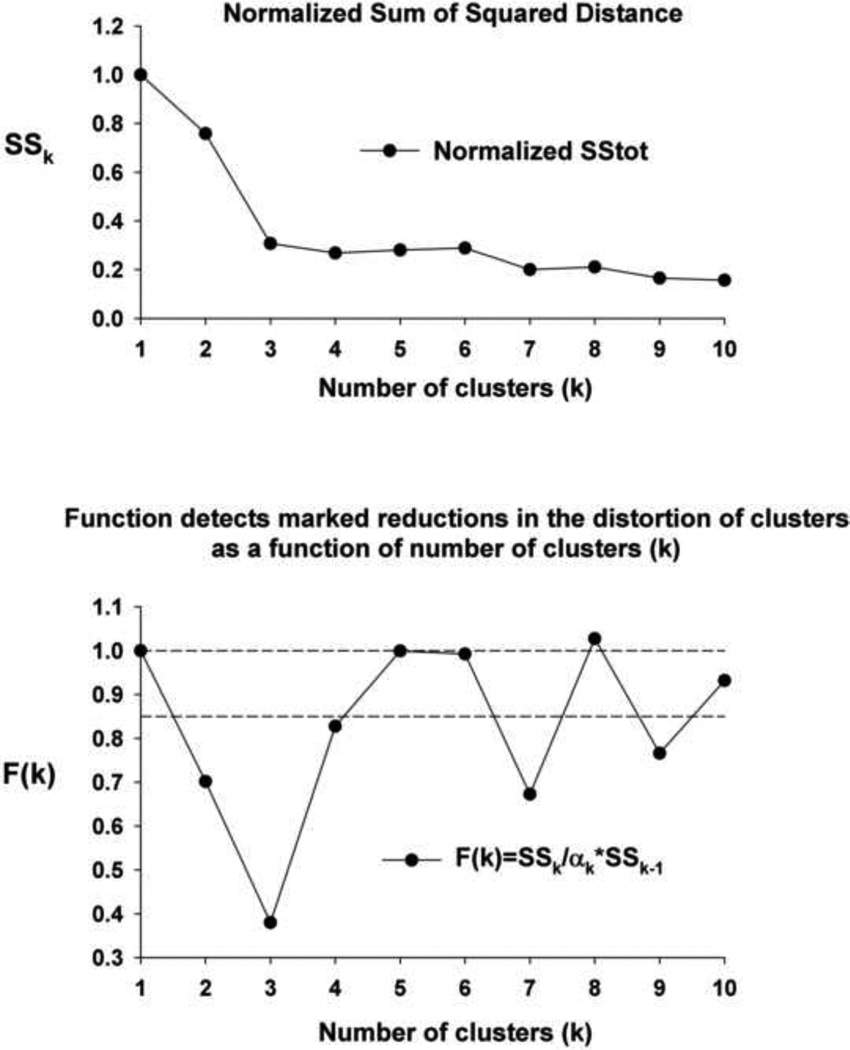
Figure 6.
Statistical Method to determine the optimal number of clusters of the data set. Upper panel: Plot of the normalized sum of squared distance (SSk) vs. the number of clusters (k) decreases as a function of k. Lower Panel: Plot of a function of the ratio of SSk to SSk-1 enhances the detection of the relative decrease in total variance of the data set that the addition of cluster k contributes. See text for details.

