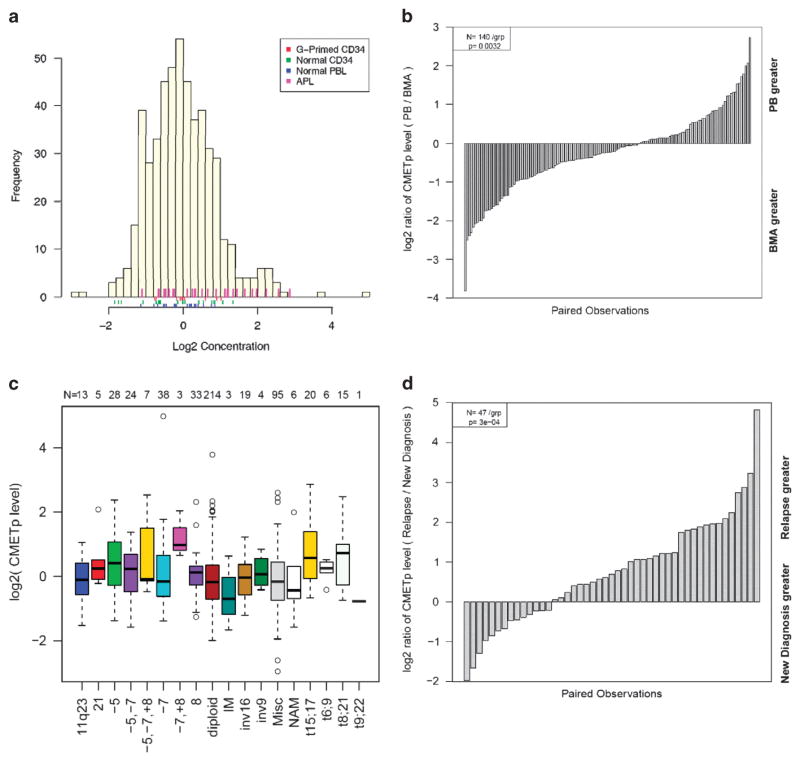
Figure 1.
(a) Histogram of MET phosphorylation levels detected in primary AML cells relative to normal and stimulated controls. (b) Distribution of MET phosphorylation levels in pairs of samples from the peripheral blood and bone marrow showing significantly higher levels in bone marrow samples. (c) Analysis of MET phosphorylation as a function of AML cytogenetic subtype. (d) Analysis of MET phosphorylation in newly diagnosed versus relapsed AML specimens, demonstrating significantly increased levels at disease relapse.

