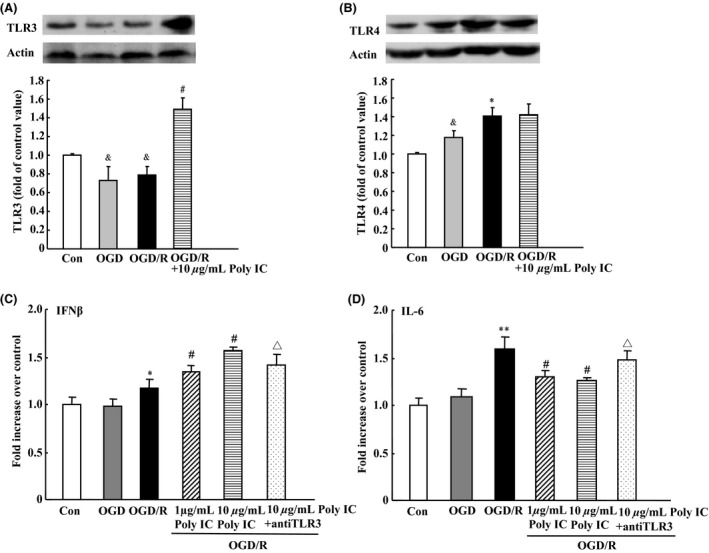
Figure 4.

Effects of Poly IC on astrocytic TLR3 and TLR4 expression and cytokine release after oxygen‐glucose deprivation/reoxygenation (OGD/R). (A and B) Immunoblot analysis of TLR3 and TLR4 expression. (C and D) IFN‐β and IL‐6 levels were measured in astrocyte media by ELISA. Values are expressed as the mean ± SD and are from three independent experiments. & P < 0.05 versus control group; *P < 0.05, **P < 0.01 versus OGD group; # P < 0.05 versus OGD/R group; Δ P < 0.05 versus 10 μg/mL Poly IC‐treated group.
