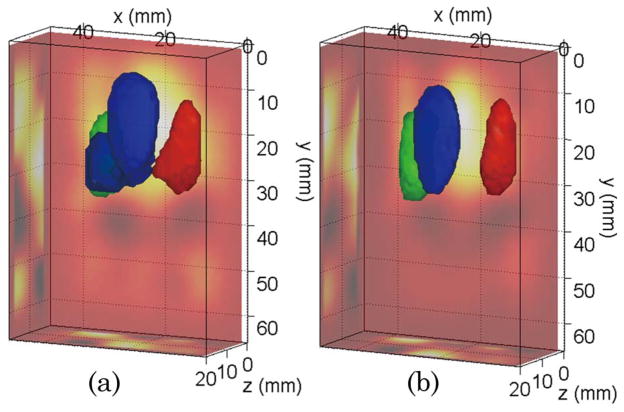
Fig. 4.
(Color online) Optical reconstructions of the phantom of Fig. 1(b) for the pattern source–point detector strategy: (a) CW data and (b) TG data. The isovolume was set at 50% of the maximum reconstructed value. The ray–sum projections are provided on the sides of the reconstructed volume.

