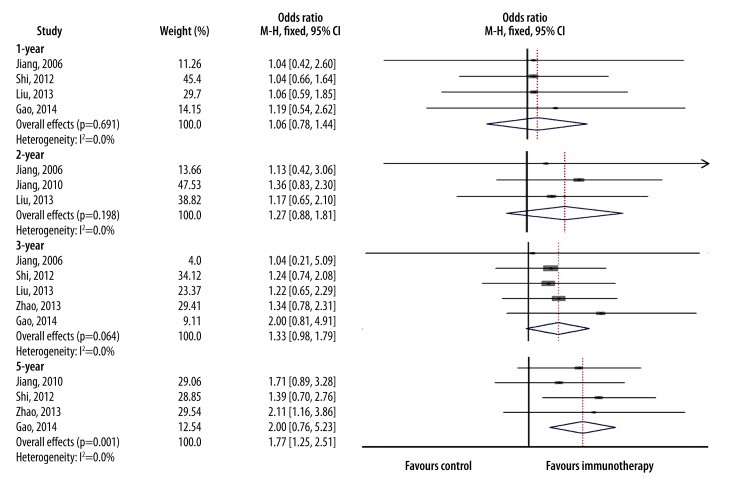
Figure 3.
Forest plot for odds ratio (OR). Overall survival rate of patients in each study at 1-, 2-, 3-, and 5-years post-CIK cell treatment was compared to the overall survival rate of patients with post-conventional chemotherapy by meta-analysis. The Mantel-Haenszel (M-H) fixed-effects model (FEM) was used. OR is represented by a square with size proportional to the provided information. The ends of the horizontal bars denote the 95% confidence interval (CI). The blue diamond represent overall OR of each study.

