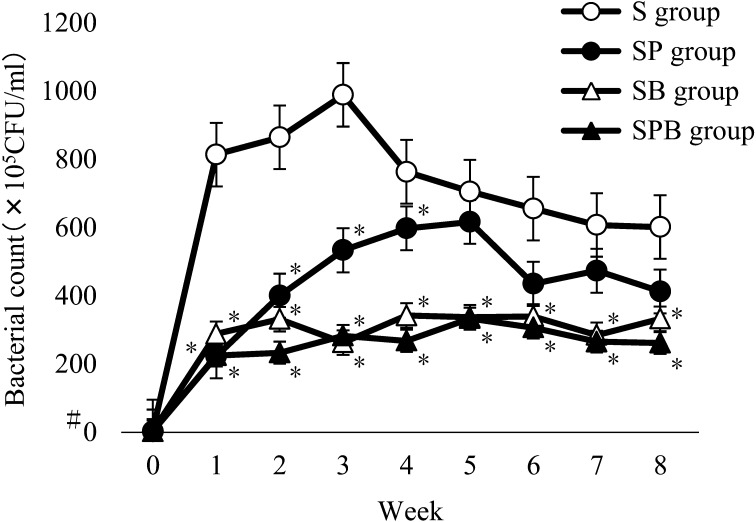
Fig. 2.
Changes in the number of oral bacteria in each group. The number of oral bacteria in the S group increased until Week 3, and subsequently decreased and became stable. On the other hand, the number of oral bacteria in the SP group gradually increased until Week 5 and subsequently decreased. The number of oral bacteria was significantly lower in the SP group than the S group until Week 4, but the difference between the groups disappeared after Week 5. The number of oral bacteria in the SB and SPB groups was significantly lower than that in the S group throughout the study period. *There was a significant difference compared with the S group at the same time (P<0.05). #Lower than the detection limit (1 × 10⁵).

