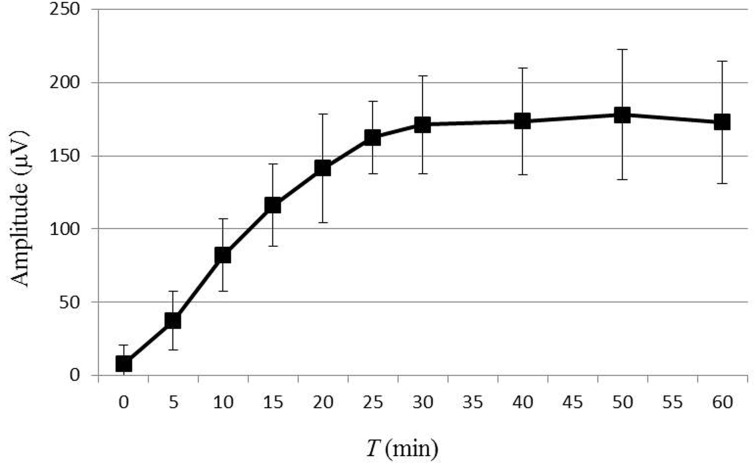
Fig. 2.
The changes in b-wave amplitude by dark adaptation time. The data represent the means of 12 eyes of 6 dogs, and the error bars represent the standard deviations. Comparison of the b-wave amplitude between each recording time and previous recording time revealed significant differences in b-wave amplitude until 25 min of dark adaptation. There was no significant change in b-wave amplitude after 30 min of dark adaptation.

