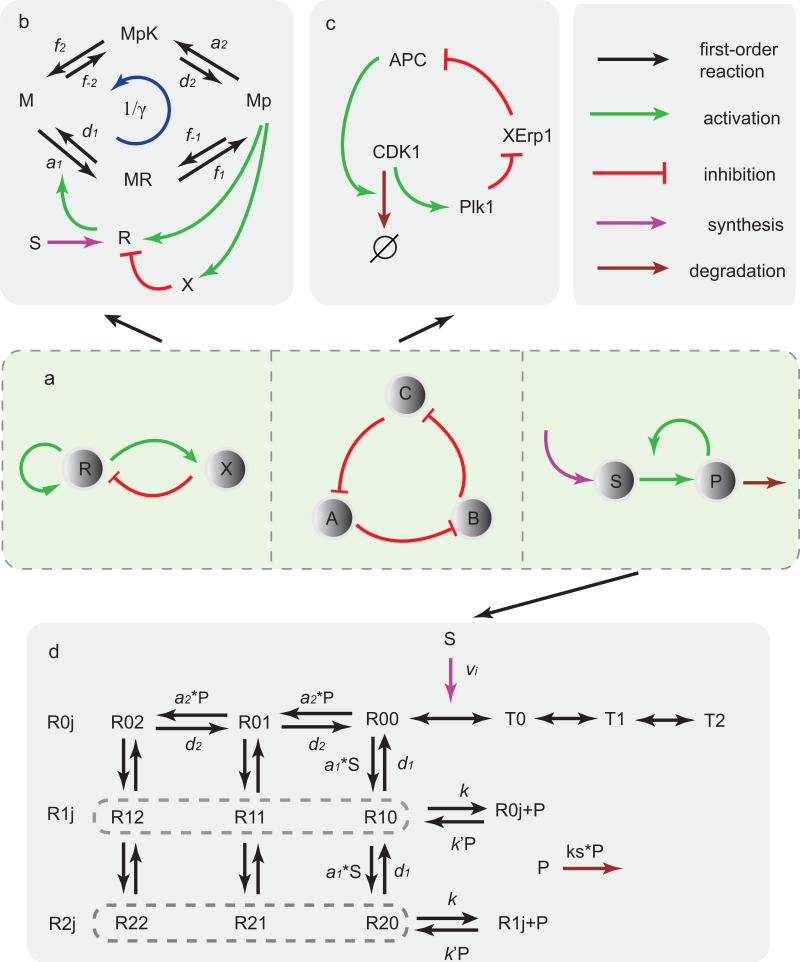
Figure 1.
Different network motifs and the corresponding biochemical oscillatory systems. (a) Illustrations of three network motifs for oscillation: activator-inhibitor, repressilator, and substrate-depletion. Lines with different colors stand for different reactions. (b) The activator-inhibitor model with a phosphorylation-dephosphorylation (PdP) cycle. R and K catalyse two opposing reactions M ↔ Mp (phosphorylation and dephosphorylation) through different intermediate complexes MR and MpK. Mp activates both R (activator) and X (inhibitor). X inhibits R by enhancing its degradation. Parameter γ = d1f–1d2f–2/(a1f1a2f2) is introduced to characterize the reversibility of the system. S is the basic synthesis rate. (c) The “repressilator” model of cell cycle in eukaryotic cells. In the simplified network, CDK1 activates Plk1, Plk1 activates APC by suppressing the inhibitor of APC, XErp1, and APC degrades CDK1, forming the mutually activing/inhibiting loop. (d) The glycolysis network. The allosteric enzyme's protomer has two states, R (binding with P) and T (unbinding with P), and only R has the catalysis activity. Each Ri,j, with i = 1,2, ···, ni and j = 1,2, ···, nj represent the number of P and S bound to R, here we used ni = nj = 2. Each Ri,j can undergo reactions of Ri,j + S ↔ Ri,j+1 ↔ Ri,j + P. Detailed descriptions and rate values are given in SI.

