Figure 4.
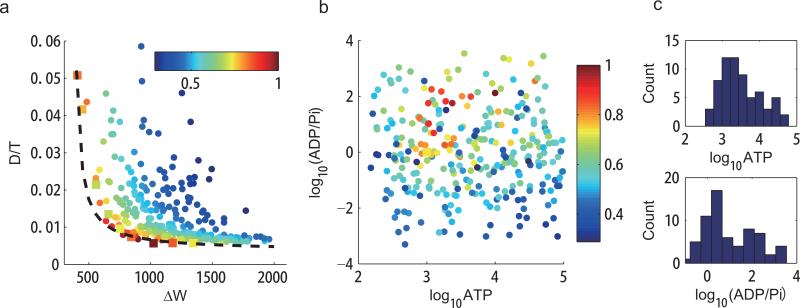
The dependence of phase diffusion on the ATP, ADP, and Pi concentrations. We studied the activator-inhibitor model with 300 randomly chosen parameters of dimensionless [ATP], [ADP] and [Pi] (see Methods). We chose V = 100. (a) D/T versus ΔW for the 300 different parameter choices. All the points lie above an envelope curve, which follows Eq. 4 with D/T = 1.94/(ΔW–400)+0.0036. Points in square indicate the points shown in Fig. 3. For a given value of D/T , the corresponding minimal energy dissipation ΔWmin is computed according to the fitted envelope curve. The efficiency is defined as E ≡ ΔWmin/ΔW. Colors of the points indicate the efficiency. (b) Distribution of the 300 randomly sampled points in the parameter space ([ATP], [ADP]/[Pi]). Colors of the points indicate the efficiency as in (a). Points with high efficiency are clustered. (c) Distribution of [ATP], and [ADP]/[Pi] for parameter choices with high efficiency E ≥ 0.75. The most probable parameter values for high efficiency are [ATP] ≈ 103, [ADP] ≈ [Pi], which corresponds to a1 = a2, f–1 = f–2 in the kinetic equations. This result indicates that high efficiency is achieved when the kinetic rates in the two halves of the PdP cycle (phosphorylation and dephosphorylation) are matched.

