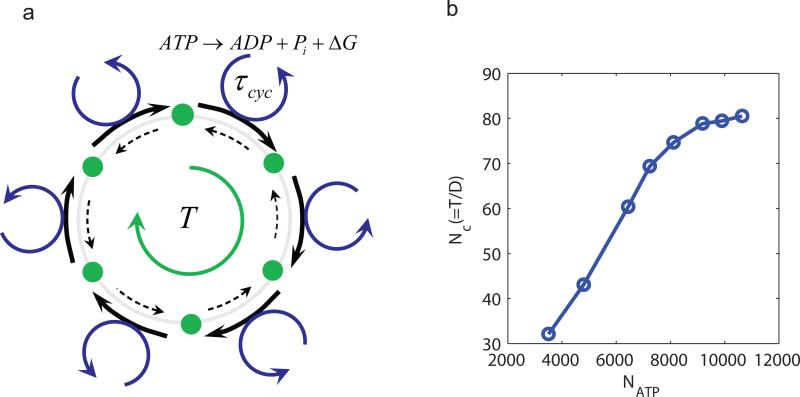
Figure 6.
Oscillation coherence increases with the number of ATP hydrolyzed per period. (a) Illustration of a biochemical oscillation as a clock in phase space. The intermediate states (green dots) are represented as the “hour ticks” of the clock. The transition from one tick to the next is coupled with a ATP hydrolysis cycle. The free energy release ΔG from the hydrolysis cycle powers the forward transition (thick solid arrow) and/or suppresses the backward transition (thin dotted arrow). The number of ATP consumed per enzyme molecule in each period T is given by T/τcyc, where τcyc is the average cycle time. (b) The accuracy of the oscillation, characterized by the number of correlated (coherent) periods Nc, increases linearly with the total number of ATP consumed per period NATP before saturating at very high NATP. We varied NATP by changing the cycle time (see Methods for details), we used V = 100 here.

