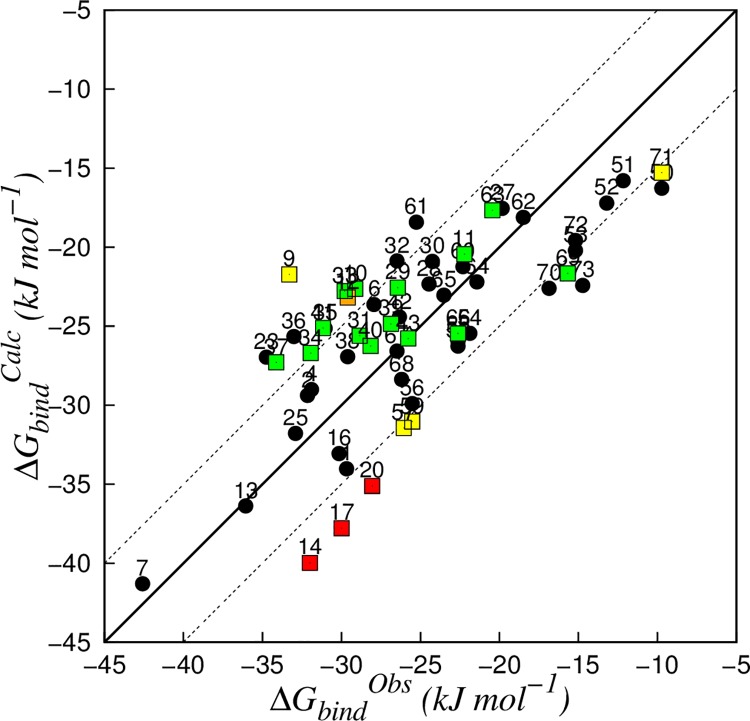
Fig 1. Correlation between calculated (∆Gbind Calc) and observed (∆GbindObs) binding free energies obtained for the CYP 1A2 LIE model (Eq 4, α = 0.587 and β = 0.267).
The solid line indicates ideal correlation between ∆GbindObs and ∆GbindCalc, and dashed lines represent deviations between calculated and experimental values of ±5 kJ mol−1 (corresponding to an error well within 1.0 pK i units). Compounds from the training set are represented in black. Test-set compounds that were found to be outlier in 0, 1, 2, and 3 analyses are represented in green, yellow, orange, and red, respectively.

