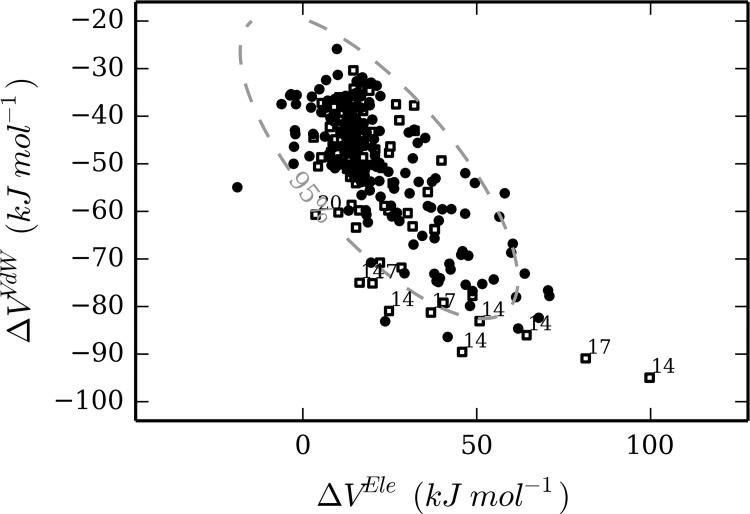
Fig 3. Distribution of ΔV Ele and ΔV VdW values (Eq 2) for training-set (black circles) and test-set (white squares) MD simulations.
The dashed line represents the confidence for the 95 percentile of the training set distribution. The simulations from the test set that are not comprised in this interval are labeled according to the corresponding compound ID.

