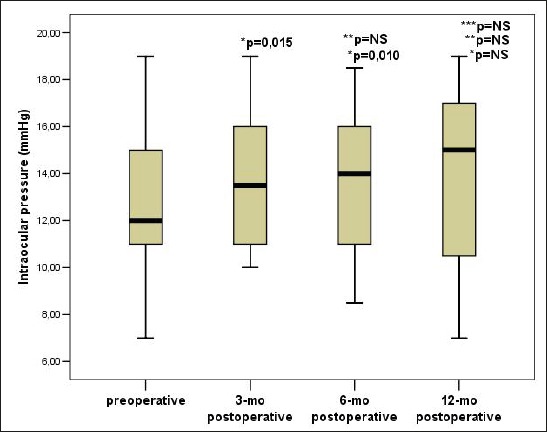
Figure 1.

Trend IOP changes before and after CXL. Data are presented as median and interquartile range (25-75 percentile), p–the probability; NS–not significant, IOP – intraocular pressure, * Compared to the value of intraocular pressure before CXL, ** Compared to the value of intraocular pressure 3 months after CXL, *** Compared to the value of intraocular pressure 6 months after CXL
