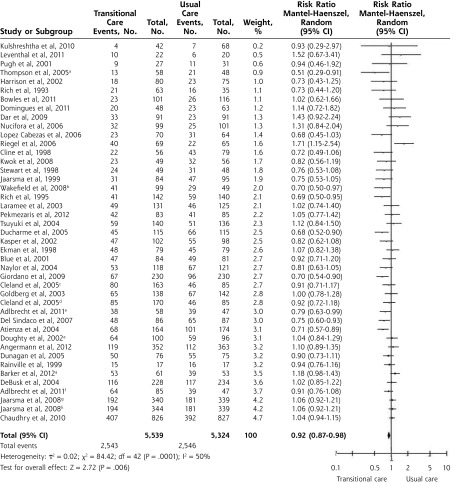
Figure 2.
Forest plot for all-cause readmission (presented by weight).
Note: Percentage of patients with events: 45.9% in the incidence group and 47.8% in the control group.
aCluster randomization.
bTelephone and video telephone follow-up.
cTelecare.
dTelephone follow-up.
eIntervention guided by N-terminal pro-B-type natriuretic peptide.
fMultidisciplinary intervention.
gFollow-up in clinic.
hFollow-up in clinic and monthly contact with the nurse.

